

The Case of the Unidentified Ratios Phil Clark pounded his desk in despair. It was 2...
Fantastic news! We've Found the answer you've been seeking!
Question:
Transcribed Image Text:
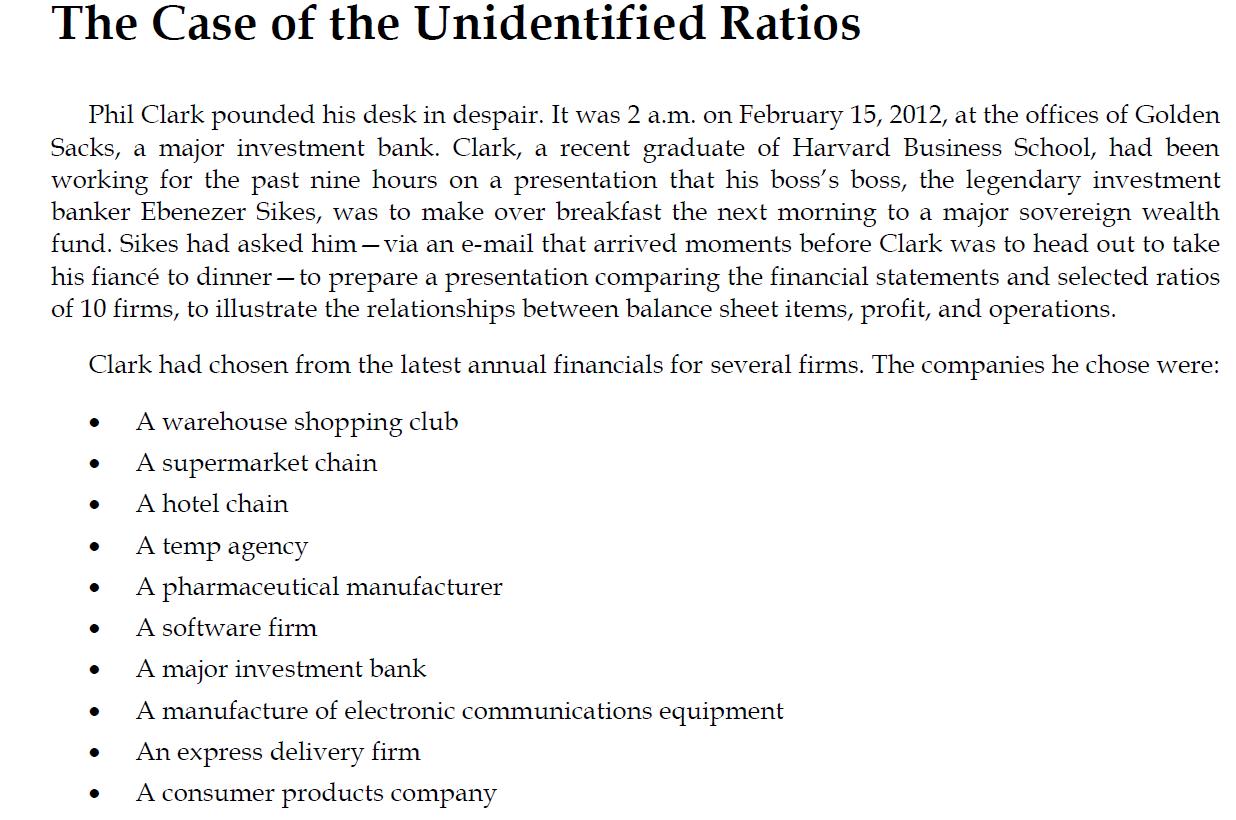
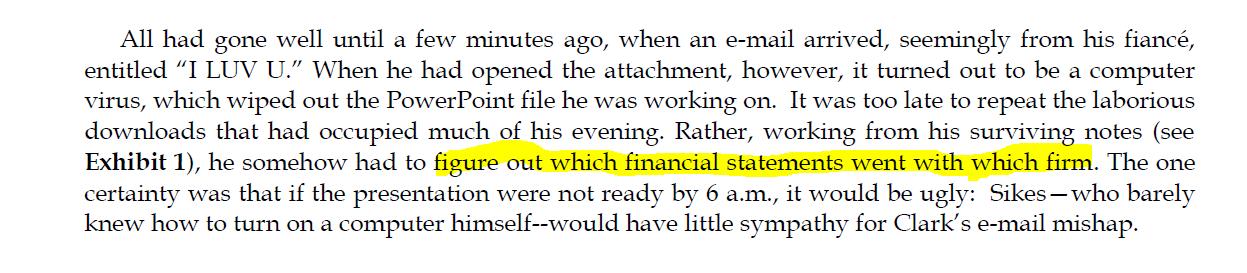
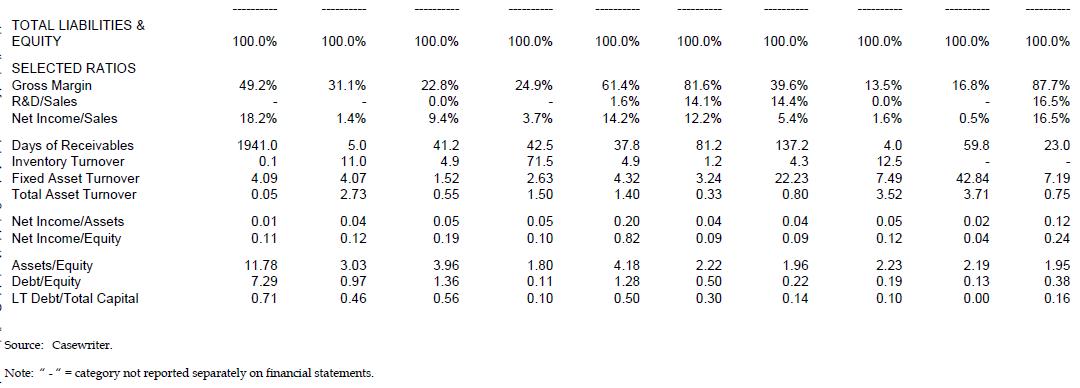
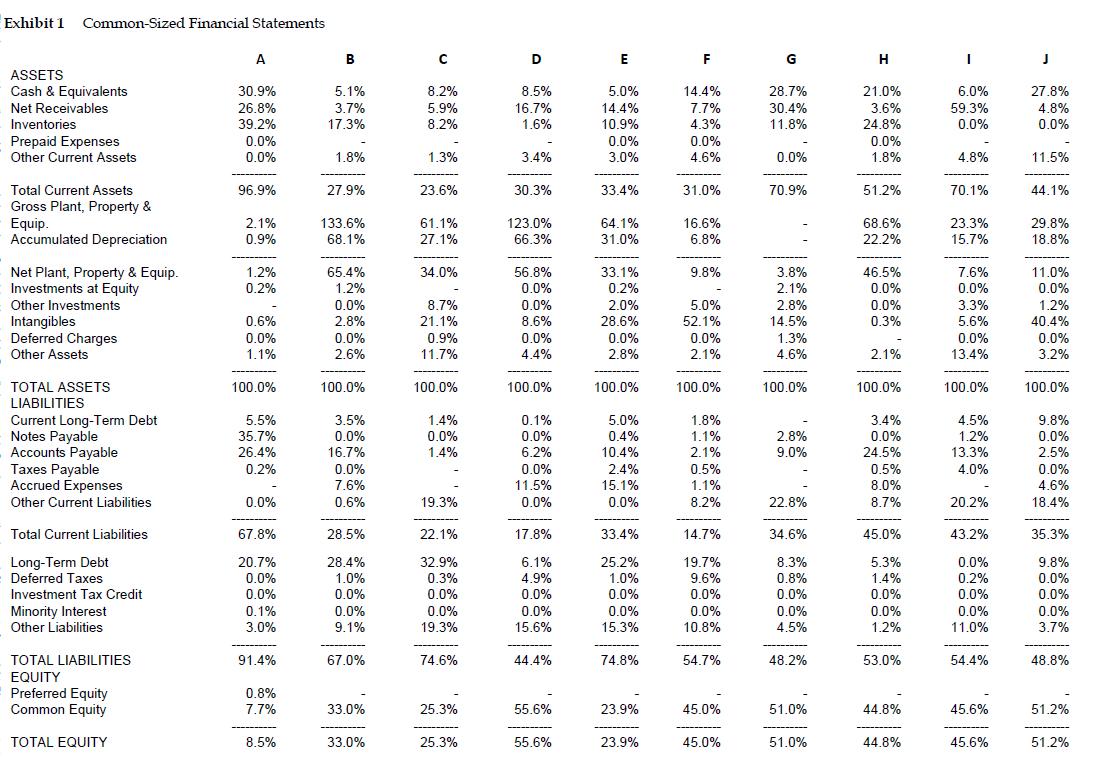
The Case of the Unidentified Ratios Phil Clark pounded his desk in despair. It was 2 a.m. on February 15, 2012, at the offices of Golden Sacks, a major investment bank. Clark, a recent graduate of Harvard Business School, had been working for the past nine hours on a presentation that his boss's boss, the legendary investment banker Ebenezer Sikes, was to make over breakfast the next morning to a major sovereign wealth fund. Sikes had asked him - via an e-mail that arrived moments before Clark was to head out to take his fiancé to dinner - to prepare a presentation comparing the financial statements and selected ratios of 10 firms, to illustrate the relationships between balance sheet items, profit, and operations. Clark had chosen from the latest annual financials for several firms. The companies he chose were: A warehouse shopping club A supermarket chain A hotel chain ● ● ● ● ● ● • A temp agency A pharmaceutical manufacturer A software firm A major investment bank A manufacture of electronic communications equipment An express delivery firm A consumer products company All had gone well until a few minutes ago, when an e-mail arrived, seemingly from his fiancé, entitled "I LUV U." When he had opened the attachment, however, it turned out to be a computer virus, which wiped out the PowerPoint file he was working on. It was too late to repeat the laborious downloads that had occupied much of his evening. Rather, working from his surviving notes (see Exhibit 1), he somehow had to figure out which financial statements went with which firm. The one certainty was that if the presentation were not ready by 6 a.m., it would be ugly: Sikes - who barely knew how to turn on a computer himself--would have little sympathy for Clark's e-mail mishap. TOTAL LIABILITIES & EQUITY SELECTED RATIOS Gross Margin R&D/Sales Net Income/Sales Days of Receivables Inventory Turnover Fixed Asset Turnover Total Asset Turnover Net Income/Assets Net Income/Equity Assets/Equity Debt/Equity LT Debt/Total Capital Source: Casewriter. 100.0% 49.2% 18.2% 1941.0 0.1 4.09 0.05 0.01 0.11 11.78 7.29 0.71 100.0% 31.1% 1.4% 5.0 11.0 4.07 2.73 0.04 0.12 3.03 0.97 0.46 Note: "_" = category not reported separately on financial statements. 100.0% 22.8% 0.0% 9.4% 41.2 4.9 1.52 0.55 0.05 0.19 3.96 1.36 0.56 100.0% 24.9% 3.7% 42.5 71.5 2.63 1.50 0.05 0.10 1.80 0.11 0.10 100.0% 61.4% 1.6% 14.2% 37.8 4.9 4.32 1.40 0.20 0.82 4.18 1.28 0.50 100.0% 81.6% 14.1% 12.2% 81.2 1.2 3.24 0.33 0.04 0.09 2.22 0.50 0.30 100.0% 39.6% 14.4% 5.4% 137.2 4.3 22.23 0.80 0.04 0.09 1.96 0.22 0.14 100.0% 13.5% 0.0% 1.6% 4.0 12.5 7.49 3.52 0.05 0.12 2.23 0.19 0.10 100.0% 16.8% 0.5% 59.8 42.84 3.71 0.02 0.04 2.19 0.13 0.00 100.0% 87.7% 16.5% 16.5% 23.0 7.19 0.75 0.12 0.24 1.95 0.38 0.16 Exhibit 1 Common-Sized Financial Statements ASSETS Cash & Equivalents Net Receivables Inventories Prepaid Expenses Other Current Assets Total Current Assets. Gross Plant, Property & Equip. Accumulated Depreciation Net Plant, Property & Equip. Investments at Equity Other Investments Intangibles Deferred Charges Other Assets TOTAL ASSETS LIABILITIES Current Long-Term Debt Notes Payable Accounts Payable Taxes Payable Accrued Expenses Other Current Liabilities Total Current Liabilities Long-Term Debt Deferred Taxes Investment Tax Credit Minority Interest Other Liabilities TOTAL LIABILITIES EQUITY Preferred Equity Common Equity TOTAL EQUITY A 30.9% 26.8% 39.2% 0.0% 0.0% 96.9% 2.1% 0.9% 1.2% 0.2% 0.6% 0.0% 1.1% 100.0% 5.5% 35.7% 26.4% 0.2% 0.0% 67.8% 20.7% 0.0% 0.0% 0.1% 3.0% 91.4% 0.8% 7.7% 8.5% B 5.1% 3.7% 17.3% 1.8% 27.9% 133.6% 68.1% 65.4% 1.2% 0.0% 2.8% 0.0% 2.6% 100.0% 3.5% 0.0% 16.7% 0.0% 7.6% 0.6% 28.5% 28.4% 1.0% 0.0% 0.0% 9.1% 67.0% 33.0% 33.0% C 8.2% 5.9% 8.2% 1.3% 23.6% 61.1% 27.1% 34.0% 8.7% 21.1% 0.9% 11.7% 100.0% 1.4% 0.0% 1.4% 19.3% 22.1% 32.9% 0.3% 0.0% 0.0% 19.3% 74.6% 25.3% 25.3% D 8.5% 16.7% 1.6% 3.4% 30.3% 123.0% 66.3% 56.8% 0.0% 0.0% 8.6% 0.0% 4.4% 100.0% 0.1% 0.0% 6.2% 0.0% 11.5% 0.0% 17.8% 6.1% 4.9% 0.0% 0.0% 15.6% 44.4% 55.6% 55.6% E 5.0% 14.4% 10.9% 0.0% 3.0% 33.4% 64.1% 31.0% 33.1% 0.2% 2.0% 28.6% 0.0% 2.8% 100.0% 5.0% 0.4% 10.4% 2.4% 15.1% 0.0% 33.4% 25.2% 1.0% 0.0% 0.0% 15.3% 74.8% 23.9% 23.9% F 14.4% 7.7% 4.3% 0.0% 4.6% 31.0% 16.6% 6.8% 9.8% 5.0% 52.1% 0.0% 2.1% 100.0% 1.8% 1.1% 2.1% 0.5% 1.1% 8.2% 14.7% 19.7% 9.6% 0.0% 0.0% 10.8% 54.7% 45.0% 45.0% G 28.7% 30.4% 11.8% 0.0% 70.9% 3.8% 2.1% 2.8% 14.5% 1.3% 4.6% 100.0% 2.8% 9.0% 22.8% 34.6% 8.3% 0.8% 0.0% 0.0% 4.5% 48.2% 51.0% 51.0% H 21.0% 3.6% 24.8% 0.0% 1.8% | 51.2% 68.6% 22.2% 46.5% 0.0% 0.0% 0.3% 2.1% 100.0% 3.4% 0.0% 24.5% 0.5% 8.0% 8.7% 45.0% 5.3% 1.4% 0.0% 0.0% 1.2% 53.0% 44.8% 44.8% I 6.0% 59.3% 0.0% 4.8% 70.1% 23.3% 15.7% 7.6% 0.0% 3.3% 5.6% 0.0% 13.4% 100.0% 4.5% 1.2% 13.3% 4.0% 20.2% 43.2% 0.0% 0.2% 0.0% 0.0% 11.0% 54.4% 45.6% 45.6% J 27.8% 4.8% 0.0% 11.5% 44.1% 29.8% 18.8% 11.0% 0.0% 1.2% 40.4% 0.0% 3.2% 100.0% 9.8% 0.0% 2.5% 0.0% 4.6% 18.4% 35.3% 9.8% 0.0% 0.0% 0.0% 3.7% 48.8% 51.2% 51.2% The Case of the Unidentified Ratios Phil Clark pounded his desk in despair. It was 2 a.m. on February 15, 2012, at the offices of Golden Sacks, a major investment bank. Clark, a recent graduate of Harvard Business School, had been working for the past nine hours on a presentation that his boss's boss, the legendary investment banker Ebenezer Sikes, was to make over breakfast the next morning to a major sovereign wealth fund. Sikes had asked him - via an e-mail that arrived moments before Clark was to head out to take his fiancé to dinner - to prepare a presentation comparing the financial statements and selected ratios of 10 firms, to illustrate the relationships between balance sheet items, profit, and operations. Clark had chosen from the latest annual financials for several firms. The companies he chose were: A warehouse shopping club A supermarket chain A hotel chain ● ● ● ● ● ● • A temp agency A pharmaceutical manufacturer A software firm A major investment bank A manufacture of electronic communications equipment An express delivery firm A consumer products company All had gone well until a few minutes ago, when an e-mail arrived, seemingly from his fiancé, entitled "I LUV U." When he had opened the attachment, however, it turned out to be a computer virus, which wiped out the PowerPoint file he was working on. It was too late to repeat the laborious downloads that had occupied much of his evening. Rather, working from his surviving notes (see Exhibit 1), he somehow had to figure out which financial statements went with which firm. The one certainty was that if the presentation were not ready by 6 a.m., it would be ugly: Sikes - who barely knew how to turn on a computer himself--would have little sympathy for Clark's e-mail mishap. TOTAL LIABILITIES & EQUITY SELECTED RATIOS Gross Margin R&D/Sales Net Income/Sales Days of Receivables Inventory Turnover Fixed Asset Turnover Total Asset Turnover Net Income/Assets Net Income/Equity Assets/Equity Debt/Equity LT Debt/Total Capital Source: Casewriter. 100.0% 49.2% 18.2% 1941.0 0.1 4.09 0.05 0.01 0.11 11.78 7.29 0.71 100.0% 31.1% 1.4% 5.0 11.0 4.07 2.73 0.04 0.12 3.03 0.97 0.46 Note: "_" = category not reported separately on financial statements. 100.0% 22.8% 0.0% 9.4% 41.2 4.9 1.52 0.55 0.05 0.19 3.96 1.36 0.56 100.0% 24.9% 3.7% 42.5 71.5 2.63 1.50 0.05 0.10 1.80 0.11 0.10 100.0% 61.4% 1.6% 14.2% 37.8 4.9 4.32 1.40 0.20 0.82 4.18 1.28 0.50 100.0% 81.6% 14.1% 12.2% 81.2 1.2 3.24 0.33 0.04 0.09 2.22 0.50 0.30 100.0% 39.6% 14.4% 5.4% 137.2 4.3 22.23 0.80 0.04 0.09 1.96 0.22 0.14 100.0% 13.5% 0.0% 1.6% 4.0 12.5 7.49 3.52 0.05 0.12 2.23 0.19 0.10 100.0% 16.8% 0.5% 59.8 42.84 3.71 0.02 0.04 2.19 0.13 0.00 100.0% 87.7% 16.5% 16.5% 23.0 7.19 0.75 0.12 0.24 1.95 0.38 0.16 Exhibit 1 Common-Sized Financial Statements ASSETS Cash & Equivalents Net Receivables Inventories Prepaid Expenses Other Current Assets Total Current Assets. Gross Plant, Property & Equip. Accumulated Depreciation Net Plant, Property & Equip. Investments at Equity Other Investments Intangibles Deferred Charges Other Assets TOTAL ASSETS LIABILITIES Current Long-Term Debt Notes Payable Accounts Payable Taxes Payable Accrued Expenses Other Current Liabilities Total Current Liabilities Long-Term Debt Deferred Taxes Investment Tax Credit Minority Interest Other Liabilities TOTAL LIABILITIES EQUITY Preferred Equity Common Equity TOTAL EQUITY A 30.9% 26.8% 39.2% 0.0% 0.0% 96.9% 2.1% 0.9% 1.2% 0.2% 0.6% 0.0% 1.1% 100.0% 5.5% 35.7% 26.4% 0.2% 0.0% 67.8% 20.7% 0.0% 0.0% 0.1% 3.0% 91.4% 0.8% 7.7% 8.5% B 5.1% 3.7% 17.3% 1.8% 27.9% 133.6% 68.1% 65.4% 1.2% 0.0% 2.8% 0.0% 2.6% 100.0% 3.5% 0.0% 16.7% 0.0% 7.6% 0.6% 28.5% 28.4% 1.0% 0.0% 0.0% 9.1% 67.0% 33.0% 33.0% C 8.2% 5.9% 8.2% 1.3% 23.6% 61.1% 27.1% 34.0% 8.7% 21.1% 0.9% 11.7% 100.0% 1.4% 0.0% 1.4% 19.3% 22.1% 32.9% 0.3% 0.0% 0.0% 19.3% 74.6% 25.3% 25.3% D 8.5% 16.7% 1.6% 3.4% 30.3% 123.0% 66.3% 56.8% 0.0% 0.0% 8.6% 0.0% 4.4% 100.0% 0.1% 0.0% 6.2% 0.0% 11.5% 0.0% 17.8% 6.1% 4.9% 0.0% 0.0% 15.6% 44.4% 55.6% 55.6% E 5.0% 14.4% 10.9% 0.0% 3.0% 33.4% 64.1% 31.0% 33.1% 0.2% 2.0% 28.6% 0.0% 2.8% 100.0% 5.0% 0.4% 10.4% 2.4% 15.1% 0.0% 33.4% 25.2% 1.0% 0.0% 0.0% 15.3% 74.8% 23.9% 23.9% F 14.4% 7.7% 4.3% 0.0% 4.6% 31.0% 16.6% 6.8% 9.8% 5.0% 52.1% 0.0% 2.1% 100.0% 1.8% 1.1% 2.1% 0.5% 1.1% 8.2% 14.7% 19.7% 9.6% 0.0% 0.0% 10.8% 54.7% 45.0% 45.0% G 28.7% 30.4% 11.8% 0.0% 70.9% 3.8% 2.1% 2.8% 14.5% 1.3% 4.6% 100.0% 2.8% 9.0% 22.8% 34.6% 8.3% 0.8% 0.0% 0.0% 4.5% 48.2% 51.0% 51.0% H 21.0% 3.6% 24.8% 0.0% 1.8% | 51.2% 68.6% 22.2% 46.5% 0.0% 0.0% 0.3% 2.1% 100.0% 3.4% 0.0% 24.5% 0.5% 8.0% 8.7% 45.0% 5.3% 1.4% 0.0% 0.0% 1.2% 53.0% 44.8% 44.8% I 6.0% 59.3% 0.0% 4.8% 70.1% 23.3% 15.7% 7.6% 0.0% 3.3% 5.6% 0.0% 13.4% 100.0% 4.5% 1.2% 13.3% 4.0% 20.2% 43.2% 0.0% 0.2% 0.0% 0.0% 11.0% 54.4% 45.6% 45.6% J 27.8% 4.8% 0.0% 11.5% 44.1% 29.8% 18.8% 11.0% 0.0% 1.2% 40.4% 0.0% 3.2% 100.0% 9.8% 0.0% 2.5% 0.0% 4.6% 18.4% 35.3% 9.8% 0.0% 0.0% 0.0% 3.7% 48.8% 51.2% 51.2%
Expert Answer:
Answer rating: 100% (QA)
Company What it represents Why A Major Investment Bank Highly leverage higher proportion of debt or ... View the full answer

Related Book For 
Intermediate Accounting
ISBN: 978-0324592375
17th Edition
Authors: James D. Stice, Earl K. Stice, Fred Skousen
Posted Date:
Students also viewed these general management questions
-
Phil Clark Jr., president of Waterways, was very pleased with how adopting a CVP approach to reporting operating income was helping management to make good business decisions with respect to...
-
Amazon vs Walmart Which of the two companies do you think faces more supply chain risks and challenges in the coming few years, as compared to the other? Why? Please also provide any references,...
-
What is the shear capacity of the RC beam described below considering the steel reinforcement and using the formula: VRsyAw 2fyd cot 8/s The shear reinforcement in the beam is provided by sets of...
-
On 1/1/22, lmani and Ahmad formed AI Partnership, a limited partnership. lmani will be the general partner and Ahmad will be a limited partner. He will not participate in management of the...
-
Draw and label the potential-energy curve for the reaction The activation energy for the reverse reaction is 23 kJ. ÎH and Ea on the diagram. What is the activation energy for the forward...
-
A ship constructed of \(2.50 \times 10^{6} \mathrm{~kg}\) of steel is roughly shaped like a box of length \(50.0 \mathrm{~m}\), width \(20.0 \mathrm{~m}\), and height \(20.0 \mathrm{~m}\). (a) What...
-
Water flows through a 40 -mm-diameter nozzle meter in a 75 - \(\mathrm{mm}\)-diameter pipe at a rate of \(0.015 \mathrm{~m}^{3} / \mathrm{s}\). Determine the pressure difference across the nozzle if...
-
Crazy Jims Mining Co. acquired mineral rights for $21,750,000. The mineral deposit is estimated at 15,000,000 tons. During the current year, 3,600,000 tons were mined and sold. a. Determine the...
-
1. Within 5.0 s of lift-off, a space shuttle reaches an altitude of 525 m, uniformly accelerating during the entire time. (a) What is its acceleration? (b) At what speed is the shuttle travelling...
-
Fun Silly Toys (FST) produces a number of space themed toys (e.g., astronaut action figures). One of the newer divisions at FST is the board game division, which currently produces and sells one...
-
The carrying amount of a piece of machinery at 30 June 2017 was $580,000. At this date there was an indication that the machinery might be impaired. In preparing for the impairment testing, you have...
-
Mississippi cracked down on gougers after Hurricane Katrina. John Shepperson was one of the gougers authorities arrested. Shepperson lives in Kentucky and he watched news reports about Katrina and...
-
A carbon tax would raise the cost of producing goods and services that create large carbon emissions, but it would encourage Americans to use less carbon-intensive goods and services, which could...
-
In an hour, Sue can produce 40 caps or 4 jackets and Tessa can produce 80 caps or 4 jackets. Who has a comparative advantage in producing caps? If Sue and Tessa specialize and trade, who will gain?
-
In 1985, urban Chinese earned 1.9 times as much as people in the countryside, which is home to 60 percent of the population. By 2007, they earned 3.3 times as much according to the United Nations....
-
After you have studied Reading Between the Lines (pp. 196197) answer the following questions. a. If a wave of natural disasters put paramedics in the news and a large number of people decide to try...
-
The governing differential equations of a system are x(t) = u(t) bx(t) x(t) x2(t) = bx(t) = x2(t) - ax2(t) where u(t) is the input to the system. The input is represented by u(t) = + Su, where u is...
-
Funds are separate fiscal and accounting entities, each with its own self-balancing set of accounts. The newly established Society for Ethical Teachings maintains two funds-a general fund for...
-
Briefly describe the four types of risk discussed in the chapter.
-
In some countries, payments of bonuses to directors may be deducted directly from Retained Earnings rather than being charged to income of the year. Does this treatment make it more or less likely...
-
Ratcliff Corporation purchased land, a building, a patent, and a franchise for the lump sum of $1,450,000. A real estate appraiser estimated the building to have a resale value of $600,000 (2/3 of...
-
If a pattern is used to model an overly broad portion of a system, the generality of resulting pattern is sacrificed. Explain with the help of an example.
-
Explain why a pattern representing rental system will not be complete and accurate.
-
What are the key characteristics of a model that makes it easily testable?

Study smarter with the SolutionInn App