7 8 0 The following data is provided for the Piedmont Corporation. All costs are actual...
Fantastic news! We've Found the answer you've been seeking!
Transcribed Image Text:
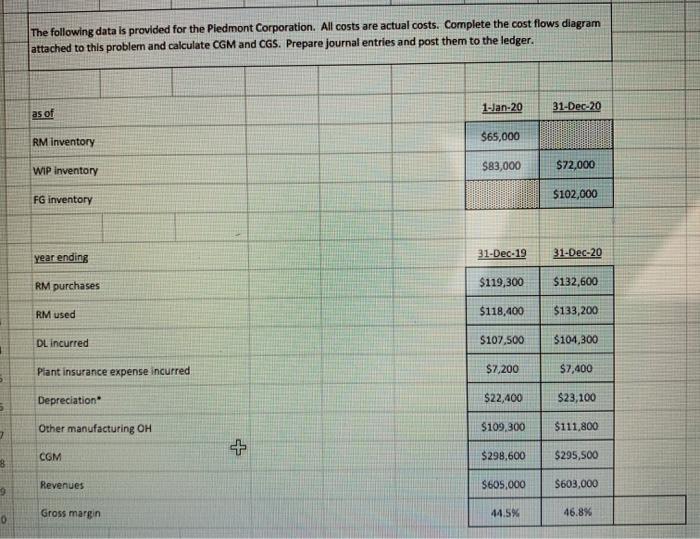
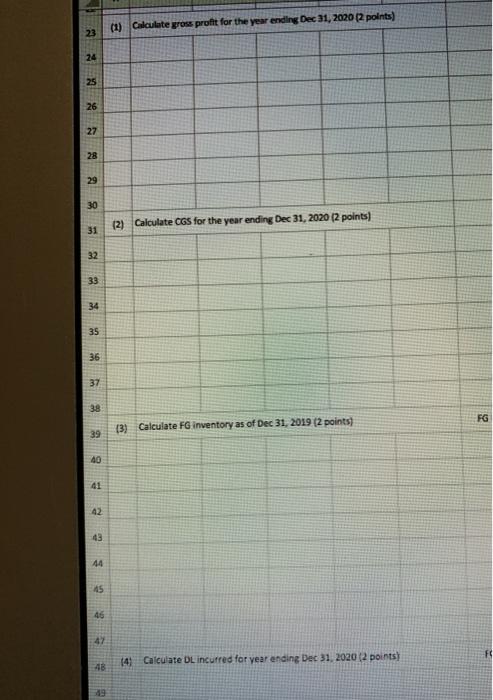
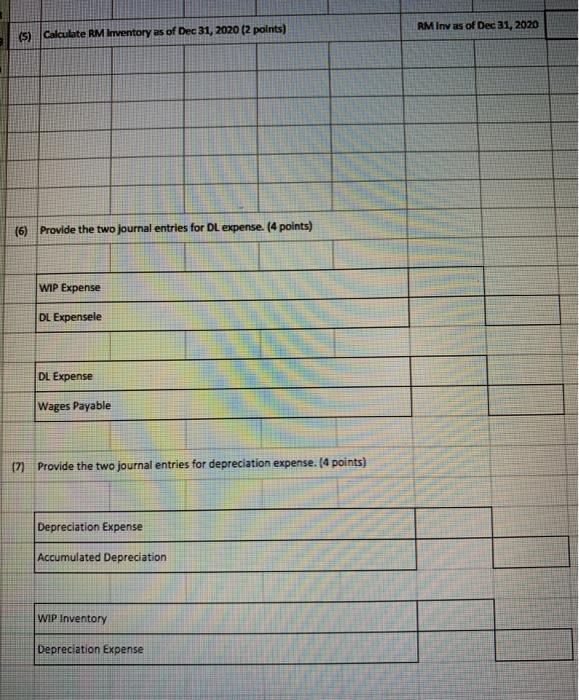
7 8 0 The following data is provided for the Piedmont Corporation. All costs are actual costs. Complete the cost flows diagram attached to this problem and calculate CGM and CGS. Prepare journal entries and post them to the ledger. as of RM inventory WIP inventory FG inventory year ending RM purchases RM used DL incurred Plant insurance expense incurred Depreciation Other manufacturing OH CGM Revenues Gross margin + 1-Jan-20 $65,000 $83,000 31-Dec-19 $7,200 $22,400 $109,300 $119,300 $118,400 $107,500 $104,300 $298,600 $605,000 31-Dec-20 44.5% $72,000 $102,000 31-Dec-20 $132,600 $133,200 $7,400 $23,100 $111,800 $295,500 $603,000 46.8% 11 23 24 25 26 27 28 29 30 31 32 33 34 35 36 37 38 39 40 41 42 43 44 45 46 47 48 49 (1) Calculate gross profit for the year ending Dec 31, 2020 (2 points) (2) Calculate CGS for the year ending Dec 31, 2020 (2 points) (3) Calculate FG inventory as of Dec 31, 2019 (2 points) (4) Calculate DL incurred for year ending Dec 31, 2020 (2 points) FG F (5) Calculate RM Inventory as of Dec 31, 2020 (2 points) (6) Provide the two journal entries for DL expense. (4 points) WIP Expense DL Expensele DL Expense Wages Payable (7) Provide the two journal entries for depreciation expense. (4 points) Depreciation Expense Accumulated Depreciation. WIP Inventory Depreciation Expense RM Invas of Dec 31, 2020 7 8 0 The following data is provided for the Piedmont Corporation. All costs are actual costs. Complete the cost flows diagram attached to this problem and calculate CGM and CGS. Prepare journal entries and post them to the ledger. as of RM inventory WIP inventory FG inventory year ending RM purchases RM used DL incurred Plant insurance expense incurred Depreciation Other manufacturing OH CGM Revenues Gross margin + 1-Jan-20 $65,000 $83,000 31-Dec-19 $7,200 $22,400 $109,300 $119,300 $118,400 $107,500 $104,300 $298,600 $605,000 31-Dec-20 44.5% $72,000 $102,000 31-Dec-20 $132,600 $133,200 $7,400 $23,100 $111,800 $295,500 $603,000 46.8% 11 23 24 25 26 27 28 29 30 31 32 33 34 35 36 37 38 39 40 41 42 43 44 45 46 47 48 49 (1) Calculate gross profit for the year ending Dec 31, 2020 (2 points) (2) Calculate CGS for the year ending Dec 31, 2020 (2 points) (3) Calculate FG inventory as of Dec 31, 2019 (2 points) (4) Calculate DL incurred for year ending Dec 31, 2020 (2 points) FG F (5) Calculate RM Inventory as of Dec 31, 2020 (2 points) (6) Provide the two journal entries for DL expense. (4 points) WIP Expense DL Expensele DL Expense Wages Payable (7) Provide the two journal entries for depreciation expense. (4 points) Depreciation Expense Accumulated Depreciation. WIP Inventory Depreciation Expense RM Invas of Dec 31, 2020
Expert Answer:
Answer rating: 100% (QA)
1 Gross margin for 31 Dec 2020 Revenue gross profit m... View the full answer

Related Book For 

Posted Date:
Students also viewed these mathematics questions
-
The following data is provided for June 2019 Production in June 5.000 (in units) Sales in June 5.000 (in units) Direct materials 100.000 Direct labor 70.000 Fixed General industrialized costs 40.000...
-
A random variable has a normal distribution with mean and known variance 57. Consider the hypothesis test Ho: 25 versus H: <25. The sample mean X is 20. Compute the value of the sample size n that...
-
The following data is provided for XYZ Company: Beginning Inventory 200 units @ 10...................$ 2,000 Purchase 350 units @ 15.........................................5,250 Purchase 450 units @...
-
Resolve the force F1 into components acting along the u and v axes and determine the magnitudes of the components. Given: F1 = 250 N F2 = 150 N θ1 = 30 deg θ2 = 30 deg θ3 = 105 deg...
-
How is brain development related to fetal capacities and behavior? What implications do individual differences in fetal behavior have for infant temperament after birth?
-
If in a reactor, uranium 237 97 U loses 10% of its weight within one day, what is its half-life? How long would it take for 99% of the original amount to disappear?
-
Two plates are at temperatures of \(T_{1}\) and \(T_{2}\) and a chemical reaction is producing heat at a constant rate within the system. Derive a model to predict the temperature distribution within...
-
In Chapter 7, you developed a use case diagram, an activity diagram, and a system sequence diagram for the use cases Rent movies and Return movies. In Chapter 11 you developed a first-cut DCD and...
-
Type of Bond Yield 1- year 0.2% 2- year 0.3 3- year 0.5 Using the expectations theory, compute the expected one-year interest rates in (a)the second year (Year 2 only) and (b)the third year (Year...
-
On January 31, 2018, The Hershey Company acquired Amplify Snack Brands, Inc., its largest business acquisition to date. Access Hersheys 2018 financial statements and media reports near the time of...
-
Solve: O dy dx HADIR x = 1 y + x Hint: Consider x as the dependent variable. -y - 2y - 2+ Cey x = y + 2y + 2 + e y = -x - 2x +2+Ce y = x + 2x + 2+ Ce
-
Lile, an insurance broker who handled all insurance for Tempo Co., purchased a fire policy from Insurance Company insuring Tempo Co.s factory against fire in the amount of \($750,000.\) Before the...
-
In the past, asteroids striking the earth have produced disastrous results. If we discovered an asteroid on a collision course with the earth, we could, in principle, deflect it and avoid an impact...
-
Joe Brown gave \($350,000\) to his wife, Mary, with which to buy real property. They orally agreed that title to the real property should be taken in the name of Mary Brown but that she should hold...
-
On January 14, 2012, Eura Mae Redmon deeded land to her daughter, Melba Taylor, and two sons, W. C. Sewell and Billy Sewell, jointly and severally, and unto their heirs, assigns and successors...
-
Mr. Sewall left his car in a parking lot owned by Fitz-Inn Auto Parks, Inc. The lot was approximately one hundred by two hundred feet in size and had a chain link fence along the rear boundary to...
-
Cash flows: Cash collected from clients Cash disbursements: Salaries paid to employees for services rendered during the year Advertising Utilities Payment of rent Balance Sheet information Accounts...
-
Three successive resonance frequencies in an organ pipe are 1310, 1834, and 2358 Hz. (a) Is the pipe closed at one end or open at both ends? (b) What is the fundamental frequency? (c) What is the...
-
An isosceles triangle sign is designed to have a triangular printed area of 600 in.2 (shaded area with a base length of a and height of h in the figure). As shown in the figure, there is a 2 in. gap...
-
An elliptical staircase that decreases can be modeled by the parametric equations x = rcos(t) y = rsin(t) z = ht/n where r = ab/[bcos(t)2 + [asin(t)2, a and b are the semimajor and semiminor axes of...
-
A 20 ft-long rod is cut into 12 pieces, which are welded together to form the frame of a rectangular box. The length of the box's base is 15 in. longer than its width. (a) Create a polynomial...
-
Classify these Bluetooth layers using the OSI model: a. baseband; b. L2CAP; c. RFCOMM.
-
Use the power state machine of Fig. 8.12 to determine the energy used in these use cases: a. idle 1 s; receive 10 ms; idle 0.1 s; transmit 5 s; b. sleep 1 min; receive 50 ms; idle 0.1 s; receive 100...
-
What are the main phases of a design review?

Study smarter with the SolutionInn App


