

Question: Review the most recent annual reports of The Coca-Cola Company and PepsiCo focusing on the balance sheet and footnote inventories. Using the correct formulas
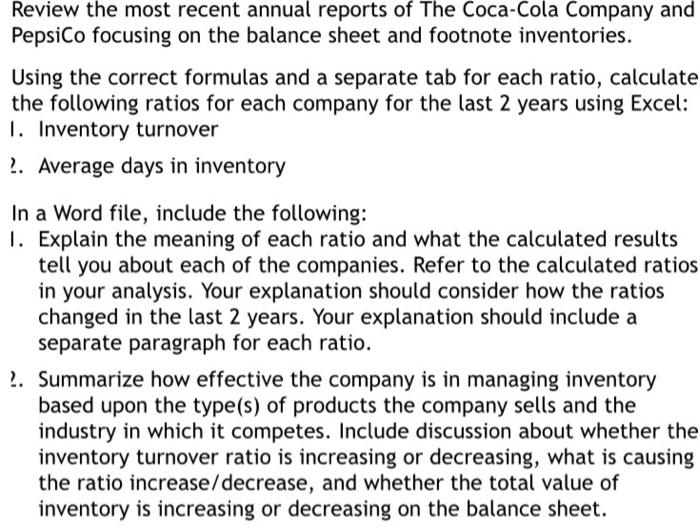
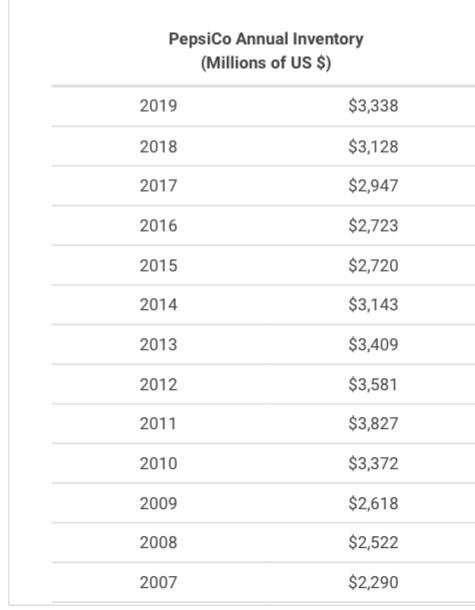
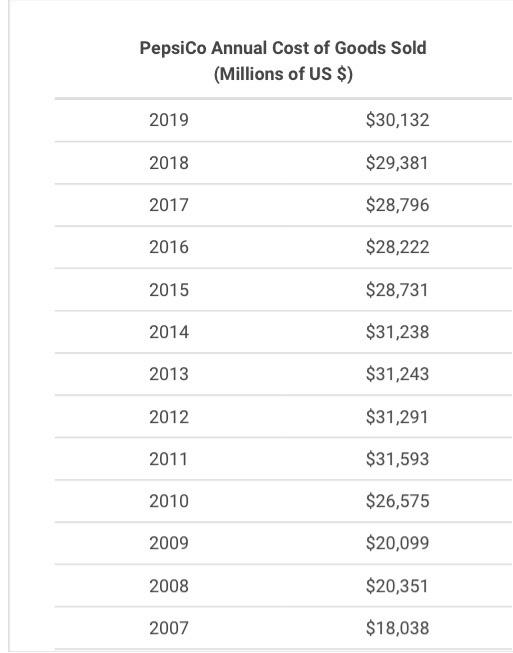
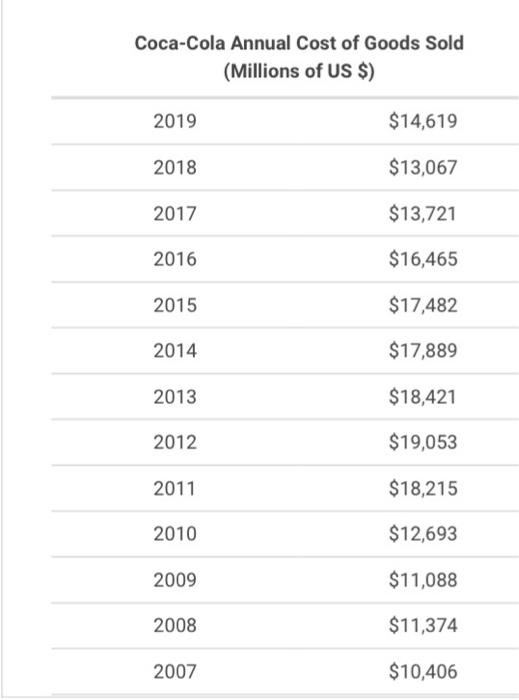
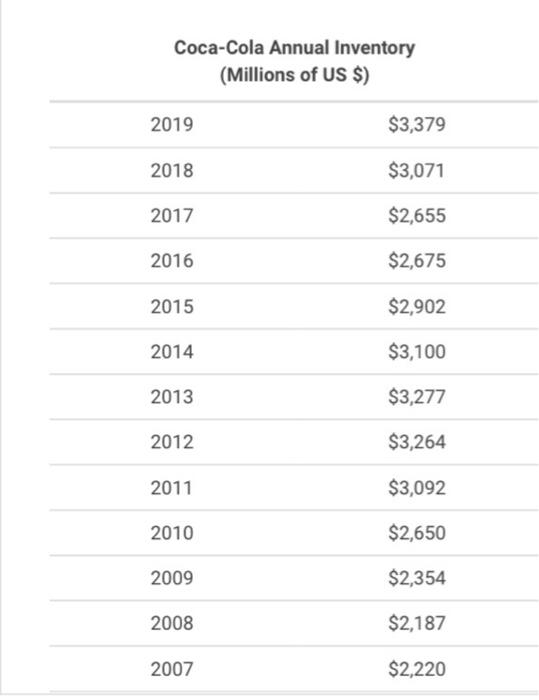
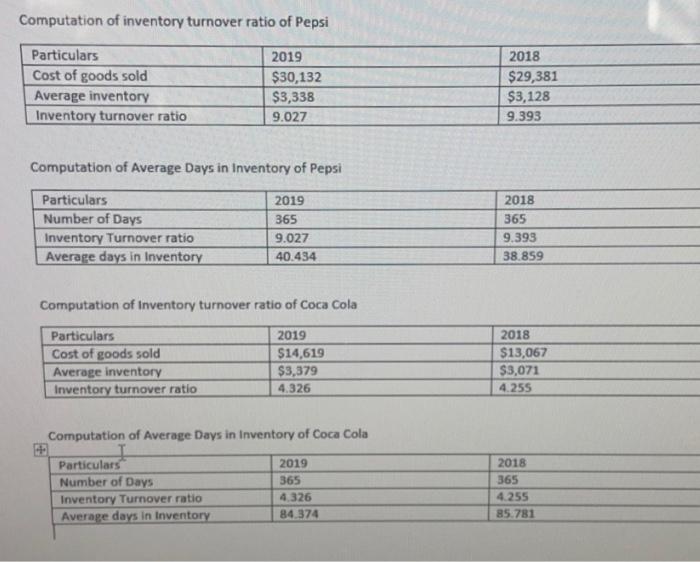
Review the most recent annual reports of The Coca-Cola Company and PepsiCo focusing on the balance sheet and footnote inventories. Using the correct formulas and a separate tab for each ratio, calculate the following ratios for each company for the last 2 years using Excel: 1. Inventory turnover 2. Average days in inventory In a Word file, include the following: 1. Explain the meaning of each ratio and what the calculated results tell you about each of the companies. Refer to the calculated ratios in your analysis. Your explanation should consider how the ratios changed in the last 2 years. Your explanation should include a separate paragraph for each ratio. 2. Summarize how effective the company is in managing inventory based upon the type(s) of products the company sells and the industry in which it competes. Include discussion about whether the inventory turnover ratio is increasing or decreasing, what is causing the ratio increase/decrease, and whether the total value of inventory is increasing or decreasing on the balance sheet. Pepsico Annual Inventory (Millions of US $) 2019 $3,338 2018 $3,128 2017 $2,947 2016 $2,723 2015 $2,720 2014 $3,143 2013 $3,409 2012 $3,581 2011 $3,827 2010 $3,372 2009 $2,618 2008 $2,522 2007 $2,290 Pepsico Annual Cost of Goods Sold (Millions of US $) 2019 $30,132 2018 $29,381 2017 $28,796 2016 $28,222 2015 $28,731 2014 $31,238 2013 $31,243 2012 $31,291 2011 $31,593 2010 $26,575 2009 $20,099 2008 $20,351 2007 $18,038 Coca-Cola Annual Cost of Goods Sold (Millions of US $) 2019 $14,619 2018 $13,067 2017 $13,721 2016 $16,465 2015 $17,482 2014 $17,889 2013 $18,421 2012 $19,053 2011 $18,215 2010 $12,693 2009 $11,088 2008 $11,374 2007 $10,406 Coca-Cola Annual Inventory (Millions of US $) 2019 $3,379 2018 $3,071 2017 $2,655 2016 $2,675 2015 $2,902 2014 $3,100 2013 $3,277 2012 $3,264 2011 $3,092 2010 $2,650 2009 $2,354 2008 $2,187 2007 $2,220 Computation of inventory turnover ratio of Pepsi Particulars 2019 2018 Cost of goods sold $30,132 $29,381 Average inventory Inventory turnover ratio $3,338 $3,128 9.027 9.393 Computation of Average Days in Inventory of Pepsi Particulars 2019 2018 Number of Days 365 365 Inventory Turnover ratio 9.027 9.393 Average days in Inventory 40.434 38.859 Computation of Inventory turnover ratio of Coca Cola Particulars 2019 2018 Cost of goods sold Average inventory Inventory turnover ratio $14,619 $3,379 $13,067 $3,071 4.326 4.255 Computation of Average Days in Inventory of Coca Cola Particulars Number of Days 2019 2018 365 365 Inventory Turnover ratio Average days in Inventory 4.326 4.255 84.374 85.781 Review the most recent annual reports of The Coca-Cola Company and PepsiCo focusing on the balance sheet and footnote inventories. Using the correct formulas and a separate tab for each ratio, calculate the following ratios for each company for the last 2 years using Excel: 1. Inventory turnover 2. Average days in inventory In a Word file, include the following: 1. Explain the meaning of each ratio and what the calculated results tell you about each of the companies. Refer to the calculated ratios in your analysis. Your explanation should consider how the ratios changed in the last 2 years. Your explanation should include a separate paragraph for each ratio. 2. Summarize how effective the company is in managing inventory based upon the type(s) of products the company sells and the industry in which it competes. Include discussion about whether the inventory turnover ratio is increasing or decreasing, what is causing the ratio increase/decrease, and whether the total value of inventory is increasing or decreasing on the balance sheet. Pepsico Annual Inventory (Millions of US $) 2019 $3,338 2018 $3,128 2017 $2,947 2016 $2,723 2015 $2,720 2014 $3,143 2013 $3,409 2012 $3,581 2011 $3,827 2010 $3,372 2009 $2,618 2008 $2,522 2007 $2,290 Pepsico Annual Cost of Goods Sold (Millions of US $) 2019 $30,132 2018 $29,381 2017 $28,796 2016 $28,222 2015 $28,731 2014 $31,238 2013 $31,243 2012 $31,291 2011 $31,593 2010 $26,575 2009 $20,099 2008 $20,351 2007 $18,038 Coca-Cola Annual Cost of Goods Sold (Millions of US $) 2019 $14,619 2018 $13,067 2017 $13,721 2016 $16,465 2015 $17,482 2014 $17,889 2013 $18,421 2012 $19,053 2011 $18,215 2010 $12,693 2009 $11,088 2008 $11,374 2007 $10,406 Coca-Cola Annual Inventory (Millions of US $) 2019 $3,379 2018 $3,071 2017 $2,655 2016 $2,675 2015 $2,902 2014 $3,100 2013 $3,277 2012 $3,264 2011 $3,092 2010 $2,650 2009 $2,354 2008 $2,187 2007 $2,220 Computation of inventory turnover ratio of Pepsi Particulars 2019 2018 Cost of goods sold $30,132 $29,381 Average inventory Inventory turnover ratio $3,338 $3,128 9.027 9.393 Computation of Average Days in Inventory of Pepsi Particulars 2019 2018 Number of Days 365 365 Inventory Turnover ratio 9.027 9.393 Average days in Inventory 40.434 38.859 Computation of Inventory turnover ratio of Coca Cola Particulars 2019 2018 Cost of goods sold Average inventory Inventory turnover ratio $14,619 $3,379 $13,067 $3,071 4.326 4.255 Computation of Average Days in Inventory of Coca Cola Particulars Number of Days 2019 2018 365 365 Inventory Turnover ratio Average days in Inventory 4.326 4.255 84.374 85.781 Review the most recent annual reports of The Coca-Cola Company and PepsiCo focusing on the balance sheet and footnote inventories. Using the correct formulas and a separate tab for each ratio, calculate the following ratios for each company for the last 2 years using Excel: 1. Inventory turnover 2. Average days in inventory In a Word file, include the following: 1. Explain the meaning of each ratio and what the calculated results tell you about each of the companies. Refer to the calculated ratios in your analysis. Your explanation should consider how the ratios changed in the last 2 years. Your explanation should include a separate paragraph for each ratio. 2. Summarize how effective the company is in managing inventory based upon the type(s) of products the company sells and the industry in which it competes. Include discussion about whether the inventory turnover ratio is increasing or decreasing, what is causing the ratio increase/decrease, and whether the total value of inventory is increasing or decreasing on the balance sheet. Pepsico Annual Inventory (Millions of US $) 2019 $3,338 2018 $3,128 2017 $2,947 2016 $2,723 2015 $2,720 2014 $3,143 2013 $3,409 2012 $3,581 2011 $3,827 2010 $3,372 2009 $2,618 2008 $2,522 2007 $2,290 Pepsico Annual Cost of Goods Sold (Millions of US $) 2019 $30,132 2018 $29,381 2017 $28,796 2016 $28,222 2015 $28,731 2014 $31,238 2013 $31,243 2012 $31,291 2011 $31,593 2010 $26,575 2009 $20,099 2008 $20,351 2007 $18,038 Coca-Cola Annual Cost of Goods Sold (Millions of US $) 2019 $14,619 2018 $13,067 2017 $13,721 2016 $16,465 2015 $17,482 2014 $17,889 2013 $18,421 2012 $19,053 2011 $18,215 2010 $12,693 2009 $11,088 2008 $11,374 2007 $10,406 Coca-Cola Annual Inventory (Millions of US $) 2019 $3,379 2018 $3,071 2017 $2,655 2016 $2,675 2015 $2,902 2014 $3,100 2013 $3,277 2012 $3,264 2011 $3,092 2010 $2,650 2009 $2,354 2008 $2,187 2007 $2,220 Computation of inventory turnover ratio of Pepsi Particulars 2019 2018 Cost of goods sold $30,132 $29,381 Average inventory Inventory turnover ratio $3,338 $3,128 9.027 9.393 Computation of Average Days in Inventory of Pepsi Particulars 2019 2018 Number of Days 365 365 Inventory Turnover ratio 9.027 9.393 Average days in Inventory 40.434 38.859 Computation of Inventory turnover ratio of Coca Cola Particulars 2019 2018 Cost of goods sold Average inventory Inventory turnover ratio $14,619 $3,379 $13,067 $3,071 4.326 4.255 Computation of Average Days in Inventory of Coca Cola Particulars Number of Days 2019 2018 365 365 Inventory Turnover ratio Average days in Inventory 4.326 4.255 84.374 85.781 Review the most recent annual reports of The Coca-Cola Company and PepsiCo focusing on the balance sheet and footnote inventories. Using the correct formulas and a separate tab for each ratio, calculate the following ratios for each company for the last 2 years using Excel: 1. Inventory turnover 2. Average days in inventory In a Word file, include the following: 1. Explain the meaning of each ratio and what the calculated results tell you about each of the companies. Refer to the calculated ratios in your analysis. Your explanation should consider how the ratios changed in the last 2 years. Your explanation should include a separate paragraph for each ratio. 2. Summarize how effective the company is in managing inventory based upon the type(s) of products the company sells and the industry in which it competes. Include discussion about whether the inventory turnover ratio is increasing or decreasing, what is causing the ratio increase/decrease, and whether the total value of inventory is increasing or decreasing on the balance sheet. Pepsico Annual Inventory (Millions of US $) 2019 $3,338 2018 $3,128 2017 $2,947 2016 $2,723 2015 $2,720 2014 $3,143 2013 $3,409 2012 $3,581 2011 $3,827 2010 $3,372 2009 $2,618 2008 $2,522 2007 $2,290 Pepsico Annual Cost of Goods Sold (Millions of US $) 2019 $30,132 2018 $29,381 2017 $28,796 2016 $28,222 2015 $28,731 2014 $31,238 2013 $31,243 2012 $31,291 2011 $31,593 2010 $26,575 2009 $20,099 2008 $20,351 2007 $18,038 Coca-Cola Annual Cost of Goods Sold (Millions of US $) 2019 $14,619 2018 $13,067 2017 $13,721 2016 $16,465 2015 $17,482 2014 $17,889 2013 $18,421 2012 $19,053 2011 $18,215 2010 $12,693 2009 $11,088 2008 $11,374 2007 $10,406 Coca-Cola Annual Inventory (Millions of US $) 2019 $3,379 2018 $3,071 2017 $2,655 2016 $2,675 2015 $2,902 2014 $3,100 2013 $3,277 2012 $3,264 2011 $3,092 2010 $2,650 2009 $2,354 2008 $2,187 2007 $2,220 Computation of inventory turnover ratio of Pepsi Particulars 2019 2018 Cost of goods sold $30,132 $29,381 Average inventory Inventory turnover ratio $3,338 $3,128 9.027 9.393 Computation of Average Days in Inventory of Pepsi Particulars 2019 2018 Number of Days 365 365 Inventory Turnover ratio 9.027 9.393 Average days in Inventory 40.434 38.859 Computation of Inventory turnover ratio of Coca Cola Particulars 2019 2018 Cost of goods sold Average inventory Inventory turnover ratio $14,619 $3,379 $13,067 $3,071 4.326 4.255 Computation of Average Days in Inventory of Coca Cola Particulars Number of Days 2019 2018 365 365 Inventory Turnover ratio Average days in Inventory 4.326 4.255 84.374 85.781 Review the most recent annual reports of The Coca-Cola Company and PepsiCo focusing on the balance sheet and footnote inventories. Using the correct formulas and a separate tab for each ratio, calculate the following ratios for each company for the last 2 years using Excel: 1. Inventory turnover 2. Average days in inventory In a Word file, include the following: 1. Explain the meaning of each ratio and what the calculated results tell you about each of the companies. Refer to the calculated ratios in your analysis. Your explanation should consider how the ratios changed in the last 2 years. Your explanation should include a separate paragraph for each ratio. 2. Summarize how effective the company is in managing inventory based upon the type(s) of products the company sells and the industry in which it competes. Include discussion about whether the inventory turnover ratio is increasing or decreasing, what is causing the ratio increase/decrease, and whether the total value of inventory is increasing or decreasing on the balance sheet. Pepsico Annual Inventory (Millions of US $) 2019 $3,338 2018 $3,128 2017 $2,947 2016 $2,723 2015 $2,720 2014 $3,143 2013 $3,409 2012 $3,581 2011 $3,827 2010 $3,372 2009 $2,618 2008 $2,522 2007 $2,290 Pepsico Annual Cost of Goods Sold (Millions of US $) 2019 $30,132 2018 $29,381 2017 $28,796 2016 $28,222 2015 $28,731 2014 $31,238 2013 $31,243 2012 $31,291 2011 $31,593 2010 $26,575 2009 $20,099 2008 $20,351 2007 $18,038 Coca-Cola Annual Cost of Goods Sold (Millions of US $) 2019 $14,619 2018 $13,067 2017 $13,721 2016 $16,465 2015 $17,482 2014 $17,889 2013 $18,421 2012 $19,053 2011 $18,215 2010 $12,693 2009 $11,088 2008 $11,374 2007 $10,406 Coca-Cola Annual Inventory (Millions of US $) 2019 $3,379 2018 $3,071 2017 $2,655 2016 $2,675 2015 $2,902 2014 $3,100 2013 $3,277 2012 $3,264 2011 $3,092 2010 $2,650 2009 $2,354 2008 $2,187 2007 $2,220 Computation of inventory turnover ratio of Pepsi Particulars 2019 2018 Cost of goods sold $30,132 $29,381 Average inventory Inventory turnover ratio $3,338 $3,128 9.027 9.393 Computation of Average Days in Inventory of Pepsi Particulars 2019 2018 Number of Days 365 365 Inventory Turnover ratio 9.027 9.393 Average days in Inventory 40.434 38.859 Computation of Inventory turnover ratio of Coca Cola Particulars 2019 2018 Cost of goods sold Average inventory Inventory turnover ratio $14,619 $3,379 $13,067 $3,071 4.326 4.255 Computation of Average Days in Inventory of Coca Cola Particulars Number of Days 2019 2018 365 365 Inventory Turnover ratio Average days in Inventory 4.326 4.255 84.374 85.781 Review the most recent annual reports of The Coca-Cola Company and PepsiCo focusing on the balance sheet and footnote inventories. Using the correct formulas and a separate tab for each ratio, calculate the following ratios for each company for the last 2 years using Excel: 1. Inventory turnover 2. Average days in inventory In a Word file, include the following: 1. Explain the meaning of each ratio and what the calculated results tell you about each of the companies. Refer to the calculated ratios in your analysis. Your explanation should consider how the ratios changed in the last 2 years. Your explanation should include a separate paragraph for each ratio. 2. Summarize how effective the company is in managing inventory based upon the type(s) of products the company sells and the industry in which it competes. Include discussion about whether the inventory turnover ratio is increasing or decreasing, what is causing the ratio increase/decrease, and whether the total value of inventory is increasing or decreasing on the balance sheet. Pepsico Annual Inventory (Millions of US $) 2019 $3,338 2018 $3,128 2017 $2,947 2016 $2,723 2015 $2,720 2014 $3,143 2013 $3,409 2012 $3,581 2011 $3,827 2010 $3,372 2009 $2,618 2008 $2,522 2007 $2,290 Pepsico Annual Cost of Goods Sold (Millions of US $) 2019 $30,132 2018 $29,381 2017 $28,796 2016 $28,222 2015 $28,731 2014 $31,238 2013 $31,243 2012 $31,291 2011 $31,593 2010 $26,575 2009 $20,099 2008 $20,351 2007 $18,038 Coca-Cola Annual Cost of Goods Sold (Millions of US $) 2019 $14,619 2018 $13,067 2017 $13,721 2016 $16,465 2015 $17,482 2014 $17,889 2013 $18,421 2012 $19,053 2011 $18,215 2010 $12,693 2009 $11,088 2008 $11,374 2007 $10,406 Coca-Cola Annual Inventory (Millions of US $) 2019 $3,379 2018 $3,071 2017 $2,655 2016 $2,675 2015 $2,902 2014 $3,100 2013 $3,277 2012 $3,264 2011 $3,092 2010 $2,650 2009 $2,354 2008 $2,187 2007 $2,220 Computation of inventory turnover ratio of Pepsi Particulars 2019 2018 Cost of goods sold $30,132 $29,381 Average inventory Inventory turnover ratio $3,338 $3,128 9.027 9.393 Computation of Average Days in Inventory of Pepsi Particulars 2019 2018 Number of Days 365 365 Inventory Turnover ratio 9.027 9.393 Average days in Inventory 40.434 38.859 Computation of Inventory turnover ratio of Coca Cola Particulars 2019 2018 Cost of goods sold Average inventory Inventory turnover ratio $14,619 $3,379 $13,067 $3,071 4.326 4.255 Computation of Average Days in Inventory of Coca Cola Particulars Number of Days 2019 2018 365 365 Inventory Turnover ratio Average days in Inventory 4.326 4.255 84.374 85.781
Step by Step Solution
3.40 Rating (162 Votes )
There are 3 Steps involved in it
TURNOVER RATIO INVENTORY COST OF Products SOLD AVG INVENTORIES AVERAGE DAYS IN I... View full answer

Get step-by-step solutions from verified subject matter experts