

Question: The following information is taken from publicly traded retailers. The data comes from the balance sheet, income statement, and Item 2 on the companies'
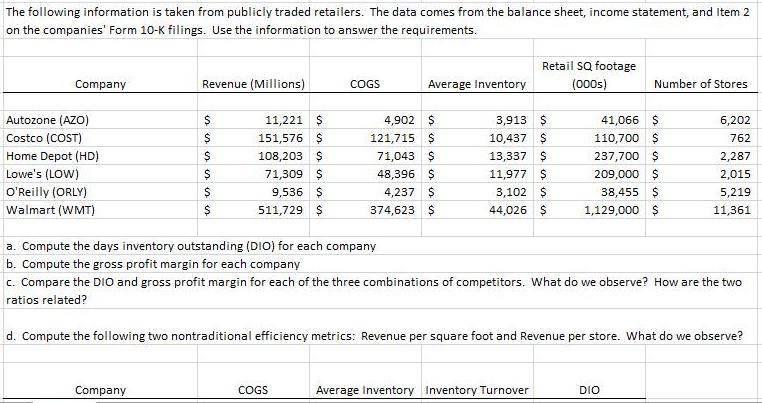
The following information is taken from publicly traded retailers. The data comes from the balance sheet, income statement, and Item 2 on the companies' Form 10-K filings. Use the information to answer the requirements. Retail SQ footage Company Revenue (Millions) COGS Average Inventory (000s) Number of Stores 4,902 $ 121,715 $ Autozone (AZO) 11,221 $ 3,913 $ 41,066 $ 6,202 Costco (COST) 151,576 $ 10,437 $ 110,700 $ 762 Home Depot (HD) 108,203 $ 71,043 $ 13,337 $ 237,700 $ 2,287 209,000 $ Lowe's (LOW) O'Reilly (ORLY) 71,309 $ 48,396 $ 11,977 $ 2,015 9,536 $ 4,237 $ 3,102 $ 38,455 $ 5,219 Walmart (WMT) 511,729 $ 374,623 $ 44,026 $ 1,129,000 $ 11,361 a. Compute the days inventory outstanding (DIO) for each company b. Compute the gross profit margin for each company c. Compare the DIO and gross profit margin for each of the three combinations of competitors. What do we observe? How are the two ratios related? d. Compute the following two nontraditional efficiency metrics: Revenue per square foot and Revenue per store. What do we observe? Company COGS Average Inventory Inventory Turnover DIO
Step by Step Solution
3.61 Rating (158 Votes )
There are 3 Steps involved in it
Revenue Company Millions Autozone AZO 11221 Costco COST 151576 Home Depot HD 108203 Lowes LOW 713091 ... View full answer

Get step-by-step solutions from verified subject matter experts