

Question: Accounts Payable Accrued Liabilities Long-term Notes Payable Total Liabilities 9,200 5,700 71,100 $86,000 13,200 1,700 80,100 $95,000 $14.000) 4,000 (9,000) $(9,000) Common Stock Retained Earnings
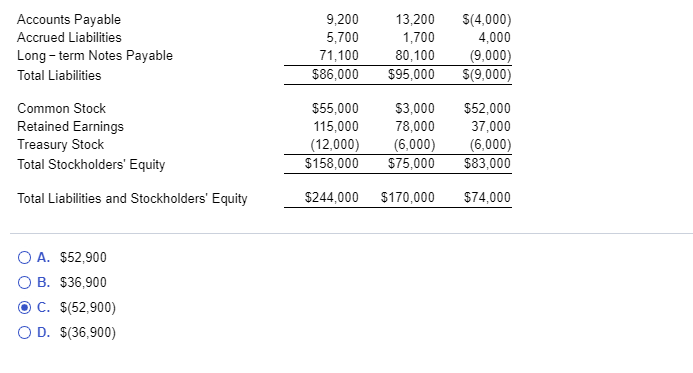
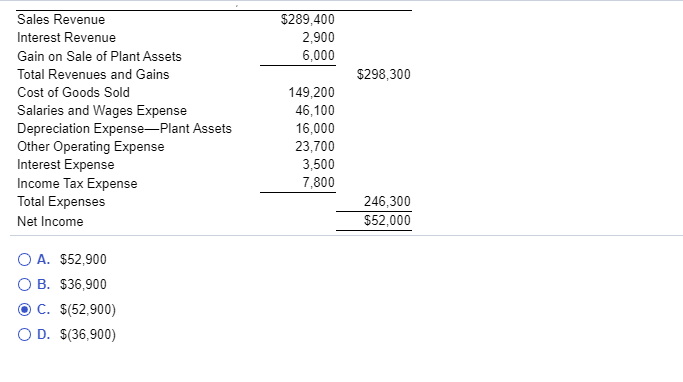
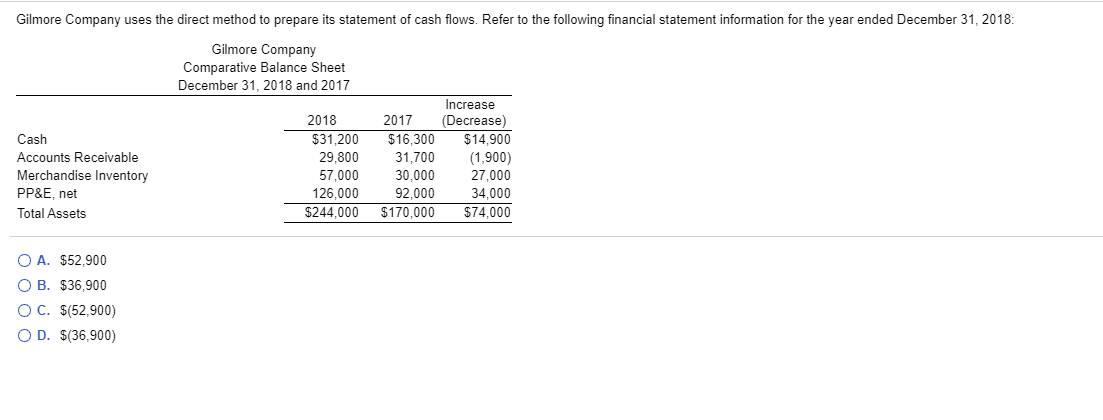
Accounts Payable Accrued Liabilities Long-term Notes Payable Total Liabilities 9,200 5,700 71,100 $86,000 13,200 1,700 80,100 $95,000 $14.000) 4,000 (9,000) $(9,000) Common Stock Retained Earnings Treasury Stock Total Stockholders' Equity $55,000 115,000 (12,000) $158,000 $3,000 78,000 (6,000) $75,000 $52,000 37,000 (6,000) $83,000 Total Liabilities and Stockholders' Equity $244,000 $170,000 $74,000 O A. $52,900 OB. $36,900 OC. $(52,900) OD. $(36,900) $289,400 2,900 6,000 $298,300 Sales Revenue Interest Revenue Gain on Sale of Plant Assets Total Revenues and Gains Cost of Goods Sold Salaries and Wages Expense Depreciation ExpensePlant Assets Other Operating Expense Interest Expense Income Tax Expense Total Expenses Net Income 149,200 46,100 16,000 23,700 3,500 7,800 246,300 $52,000 O A. $52,900 O B. $36,900 OC. $(52,900) OD. $(36,900) Gilmore Company uses the direct method to prepare its statement of cash flows. Refer to the following financial statement information for the year ended December 31, 2018: Gilmore Company Comparative Balance Sheet December 31, 2018 and 2017 Cash Accounts Receivable Merchandise Inventory PP&E, net Total Assets 2018 $31,200 29,800 57,000 126,000 $244,000 2017 $16,300 31,700 30,000 92,000 $170,000 Increase (Decrease) $14,900 (1,900) 27,000 34,000 $74,000 O A. $52,900 O B. $36,900 OC. $(52,900) OD. $(36,900) Accounts Payable Accrued Liabilities Long-term Notes Payable Total Liabilities 9,200 5,700 71,100 $86,000 13,200 1,700 80,100 $95,000 $14.000) 4,000 (9,000) $(9,000) Common Stock Retained Earnings Treasury Stock Total Stockholders' Equity $55,000 115,000 (12,000) $158,000 $3,000 78,000 (6,000) $75,000 $52,000 37,000 (6,000) $83,000 Total Liabilities and Stockholders' Equity $244,000 $170,000 $74,000 O A. $52,900 OB. $36,900 OC. $(52,900) OD. $(36,900) $289,400 2,900 6,000 $298,300 Sales Revenue Interest Revenue Gain on Sale of Plant Assets Total Revenues and Gains Cost of Goods Sold Salaries and Wages Expense Depreciation ExpensePlant Assets Other Operating Expense Interest Expense Income Tax Expense Total Expenses Net Income 149,200 46,100 16,000 23,700 3,500 7,800 246,300 $52,000 O A. $52,900 O B. $36,900 OC. $(52,900) OD. $(36,900) Gilmore Company uses the direct method to prepare its statement of cash flows. Refer to the following financial statement information for the year ended December 31, 2018: Gilmore Company Comparative Balance Sheet December 31, 2018 and 2017 Cash Accounts Receivable Merchandise Inventory PP&E, net Total Assets 2018 $31,200 29,800 57,000 126,000 $244,000 2017 $16,300 31,700 30,000 92,000 $170,000 Increase (Decrease) $14,900 (1,900) 27,000 34,000 $74,000 O A. $52,900 O B. $36,900 OC. $(52,900) OD. $(36,900)
Step by Step Solution
There are 3 Steps involved in it

Get step-by-step solutions from verified subject matter experts