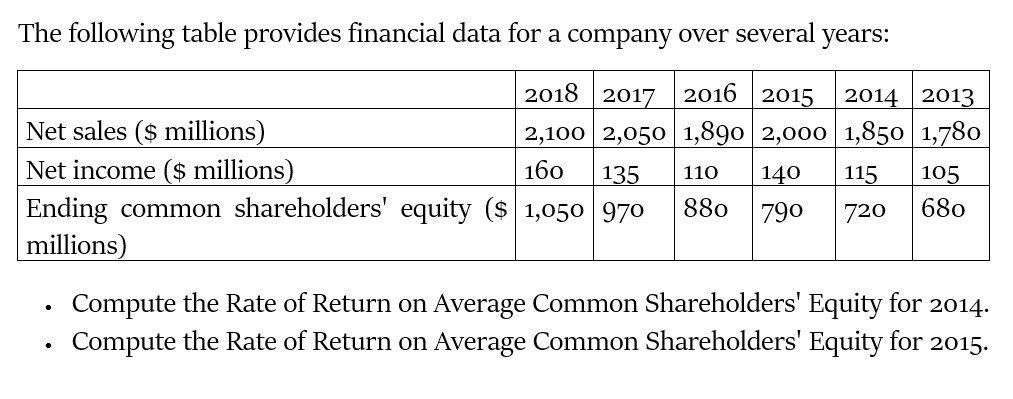
Question: Accurate Answer The following table provides financial data for a company over several years: 2018 | 2017 | 2016 | 2015 | 2014 | 2013

Accurate Answer

Accurate Answer The following table provides
The following table provides financial data for a company over several years: 2018 | 2017 | 2016 | 2015 | 2014 | 2013 Net sales ($ millions) 2,100 | 2,050 | 1,890 | 2,000 | 1,850 | 1,780 Net income ($ millions) 160 /135 |110 /|140 |/115 |105 Ending common shareholders' equity ($|1,050|970 |880 |790 |720 | 680 millions) - Compute the Rate of Return on Average Common Shareholders' Equity for 2014. - Compute the Rate of Return on Average Common Shareholders' Equity for 2015

Step by Step Solution

There are 3 Steps involved in it

1 Expert Approved Answer
Step: 1 Unlock blur-text-image
Question Has Been Solved by an Expert!

Get step-by-step solutions from verified subject matter experts

Step: 2 Unlock
Step: 3 Unlock

Students Have Also Explored These Related Finance Questions!