

Question: ack to Assignment Keep the Highest / 4 Attempts 3. Minimum wage legislation The following graph shows the labor market in the fast-food industry in
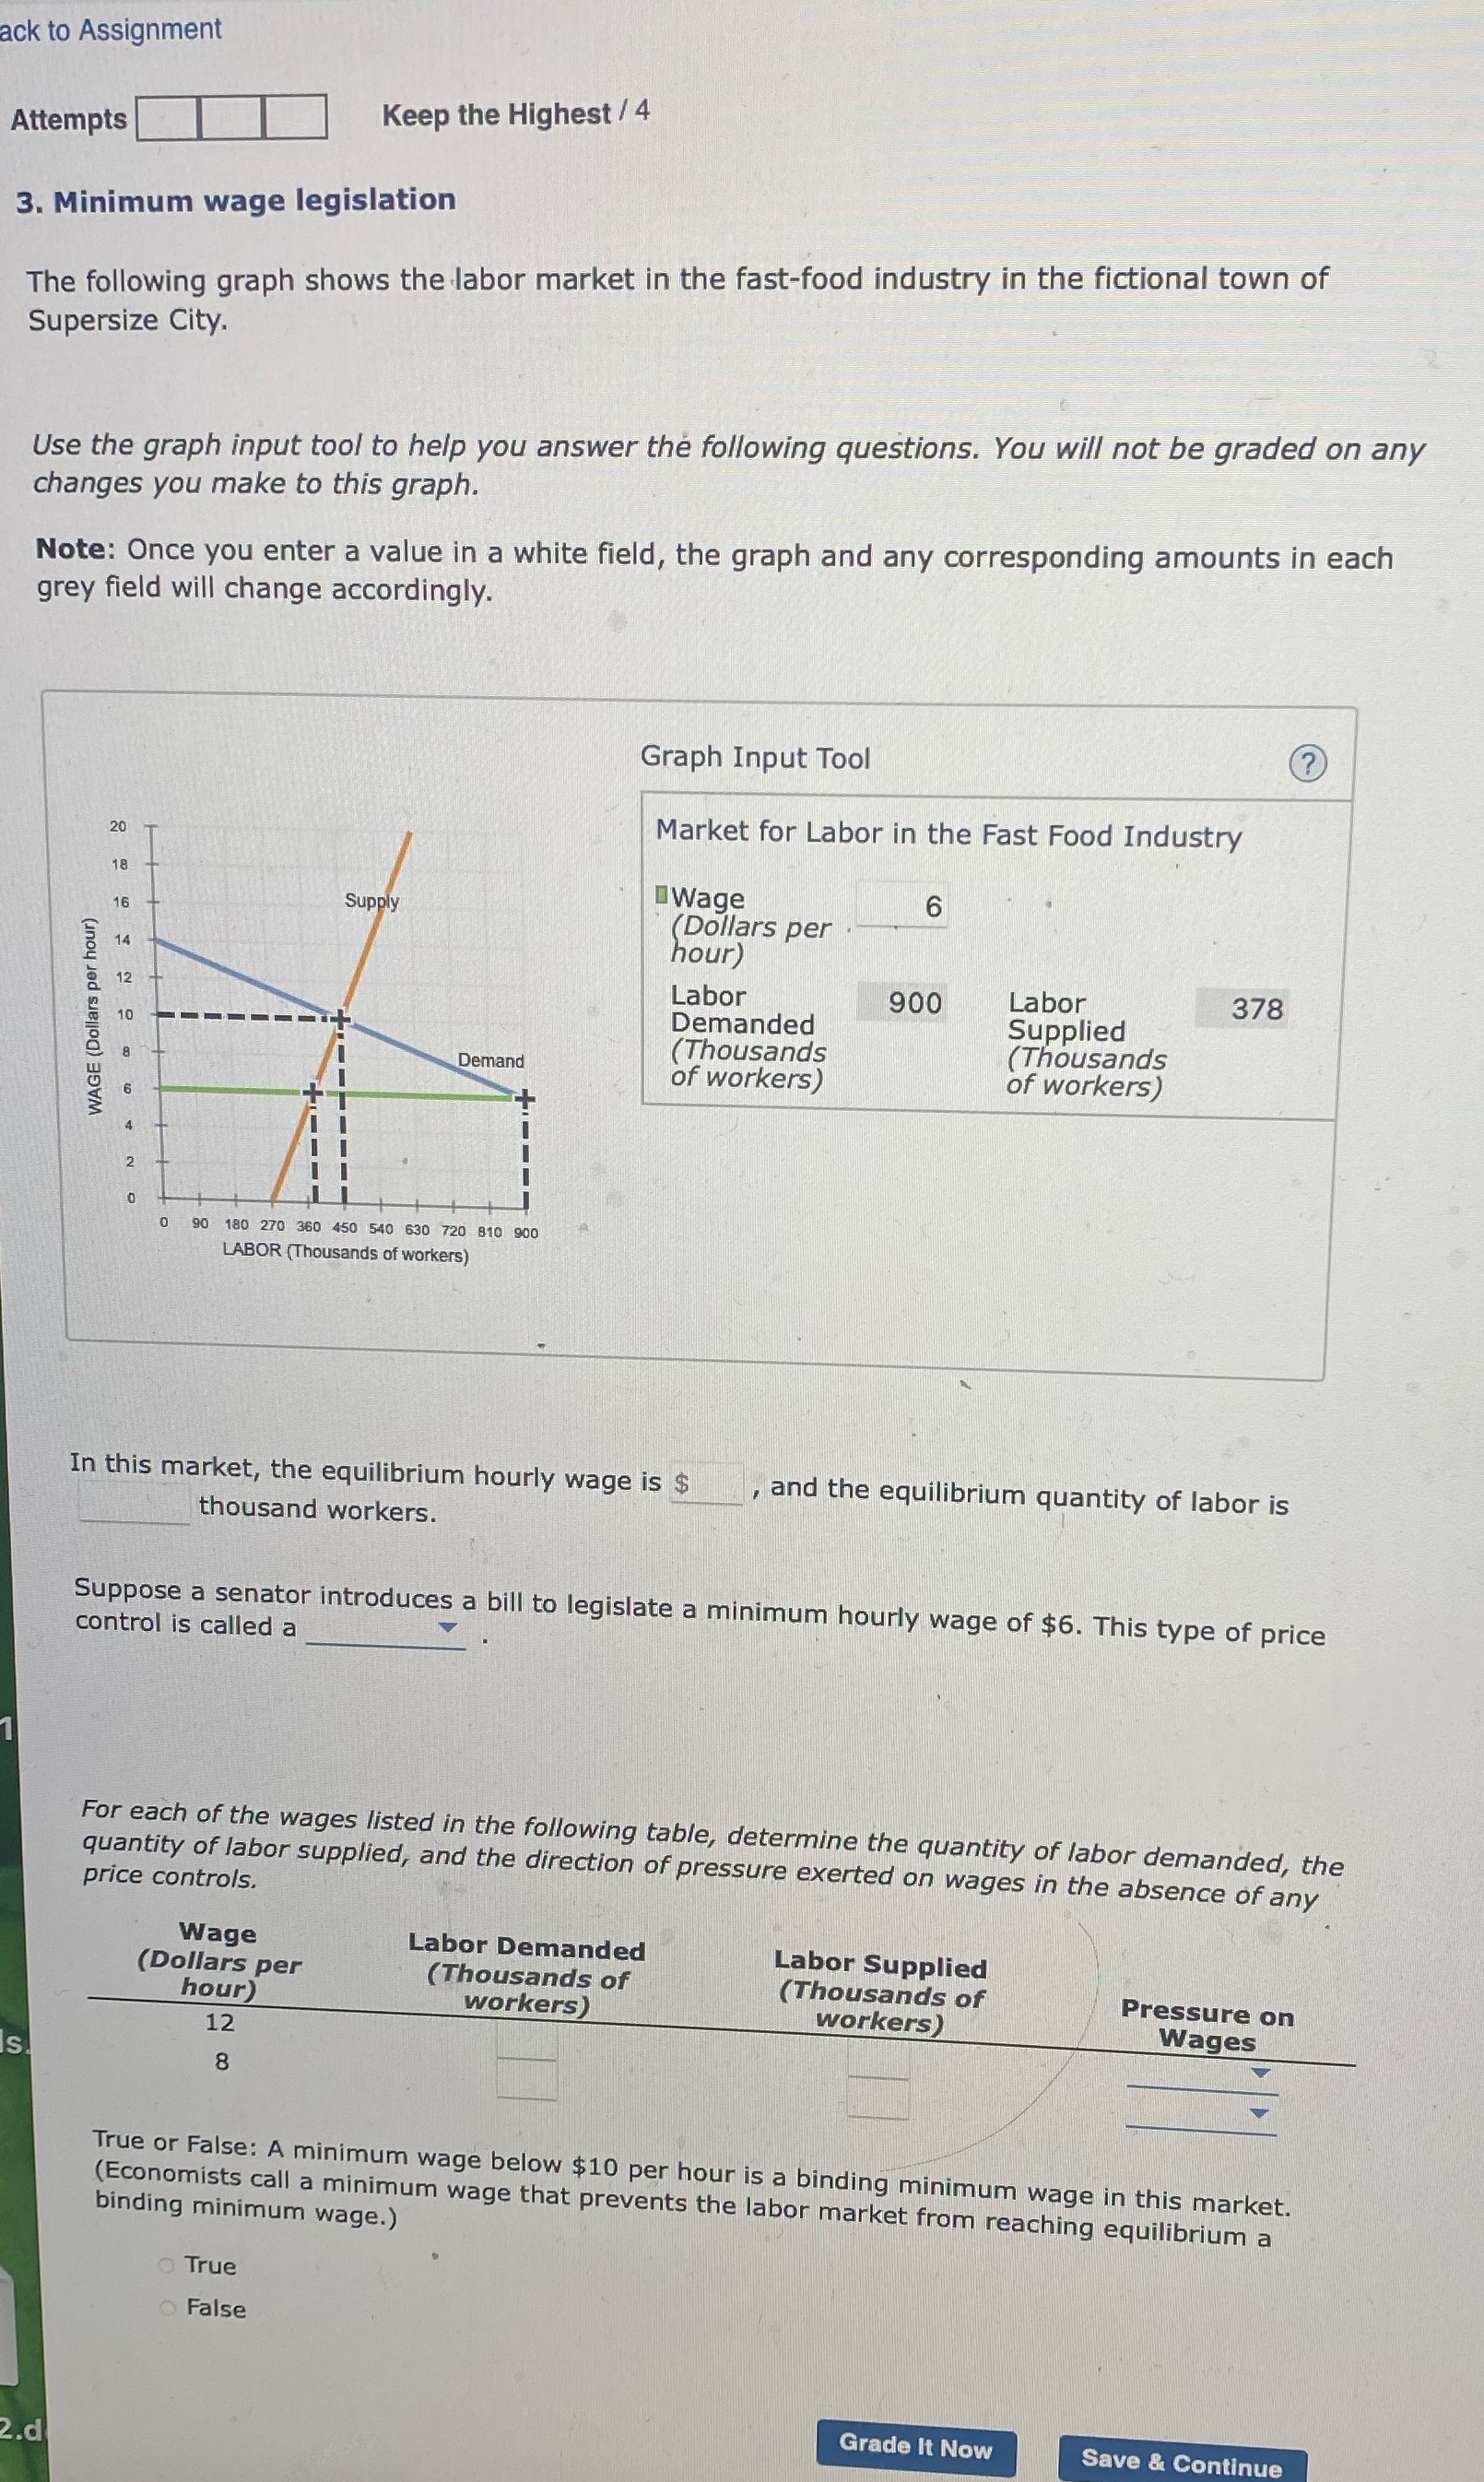
ack to Assignment Keep the Highest / 4 Attempts 3. Minimum wage legislation The following graph shows the labor market in the fast-food industry in the fictional town of Supersize City. Use the graph input tool to help you answer the following questions. You will not be graded on any changes you make to this graph. Note: Once you enter a value in a white field, the graph and any corresponding amounts in each grey field will change accordingly. Graph Input Tool ? Market for Labor in the Fast Food Industry Wage 6 Supply ( Dollars per hour) Labor 900 Labor 378 Demanded Supplied WAGE (Dollars per hour) (Thousands (Thousands Demand of workers) of workers) N 90 180 270 360 450 540 630 720 810 900 LABOR (Thousands of workers) In this market, the equilibrium hourly wage is $ , and the equilibrium quantity of labor is thousand workers. Suppose a senator introduces a bill to legislate a minimum hourly wage of $6. This type of price control is called a For each of the wages listed in the following table, determine the quantity of labor demanded, the quantity of labor supplied, and the direction of pressure exerted on wages in the absence of any price controls. Wage Labor Demanded Labor Supplied (Dollars per (Thousands of (Thousands of hour) workers) Pressure on workers) Wages 12 8 True or False: A minimum wage below $10 per hour is a binding minimum wage in this market. Economists call a minimum wage that prevents the labor market from reaching equilibrium a binding minimum wage.) O True False Grade It Now 2.d Save & Continue
Step by Step Solution
There are 3 Steps involved in it

Get step-by-step solutions from verified subject matter experts