

Question: Acme Inc. is looking to predict their spending plan as best as they can and to make significant improvements to estimate future demand in the
| Acme Inc. is looking to predict their spending plan as best as they can and to make significant improvements to estimate future demand in the presence of uncertainty . You are the Private Fleet Manager and you want to make sure you can accurately budget for diesel fuel by using a suitable forecasting technique . You have been given basic raw data to forecast and make recommendations. Perform a forecasting analysis to predict the 12 week future forecast for diesel fuel. Use : a. 5-p moving average. b. Exponential smoothing. Choose the best alpha value that you would recommend and make sure to explain your approach. c. Is the linear regression between WTI and Diesel cost a good model for this exercise? What are your recommendations? d. Research another factor ( besides WTI and Diesel cost), try to find the data for this variable and then perform a multiple linear regression to see if you can get a good model . |
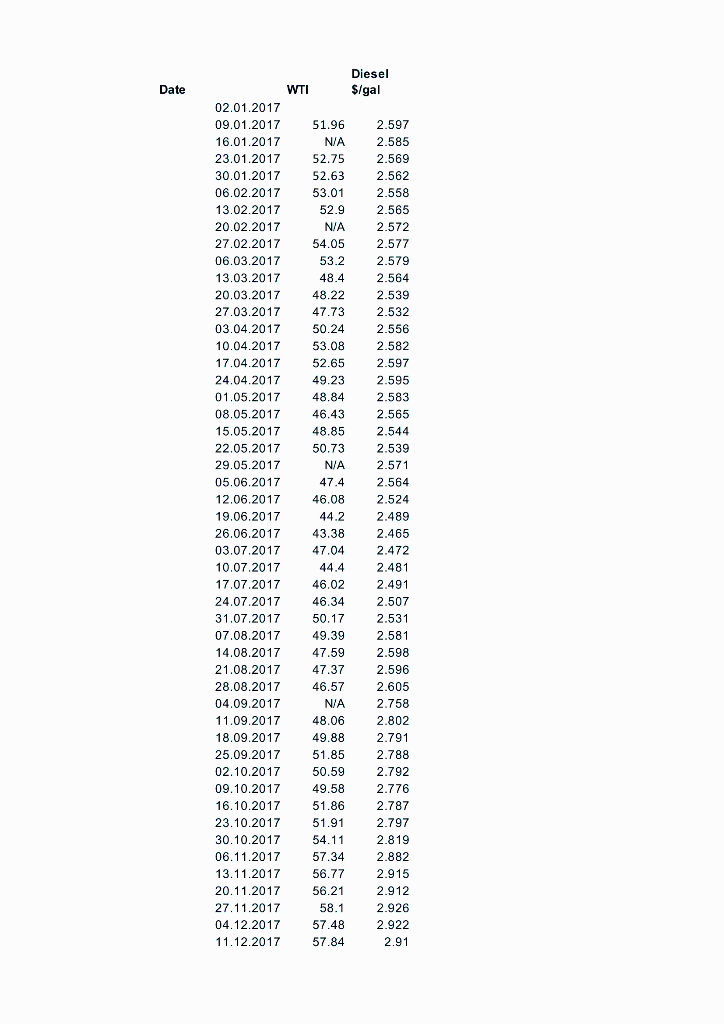
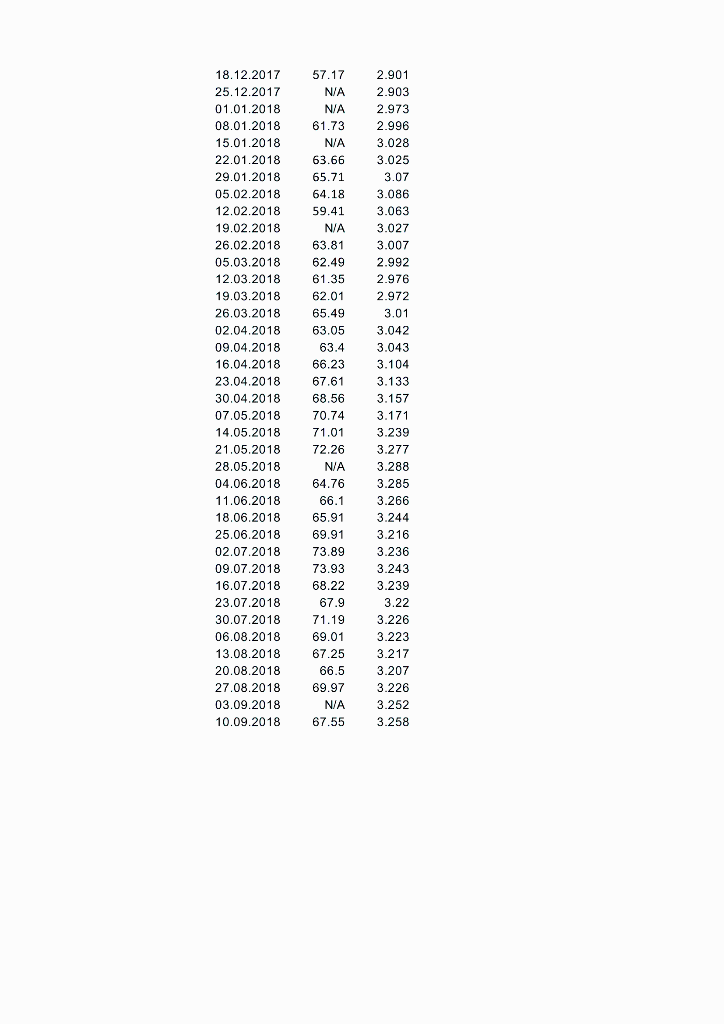
Diesel $/gal Date WTI 02.01.2017 09.01.2017 51.96 16.01.2017 N/A 23.01.2017 52.75 30.01.2017 52.63 06.02.2017 53.01 13.02.2017 52.9 20.02.2017 N/A 27.02.2017 54.05 06.03.2017 53.2 13.03.2017 48.4 20.03.2017 48.22 27.03.2017 47.73 03.04.2017 50.24 10.04.2017 53.08 17.04.2017 52.65 24.04.2017 49.23 01.05.2017 48.84 08.05.2017 46.43 15.05.2017 48.85 22.05.2017 50.73 29.05.2017 NA 05.06.2017 47.4 12.06.2017 46.08 19.06.2017 44.2 26.06.2017 43.38 03.07.2017 47.04 10.07.2017 44.4 17.07.2017 46.02 24.07.2017 46.34 31.07.2017 50.17 07.08.2017 49.39 14.08.2017 47.59 21.08.2017 47.37 28.08.2017 46.57 04.09.2017 N/A 11.09.2017 48.06 18.09.2017 49.88 25.09.2017 51.85 02.10.2017 50.59 09.10.2017 49.58 16.10.2017 51.86 23.10.2017 51.91 30.10.2017 54.11 06.11.2017 57.34 13.11.2017 56.77 20.11.2017 56.21 27.11.2017 58.1 04.12.2017 57.48 11.12.2017 57.84 2.597 2.585 2.569 2.562 2.558 2.565 2.572 2.577 2.579 2.564 2.539 2.532 2.556 2.582 2.597 2.595 2.583 2.565 2.544 2.539 2.571 2.564 2.524 2.489 2.465 2.472 2.481 2.491 2.507 2.531 2.581 2.598 2.596 2.605 2.758 2.802 2.791 2.788 2.792 2.776 2.787 2.797 2.819 2.882 2.915 2.912 2.926 2.922 2.91 57.17 N/A N/A 61.73 N/A 18.12.2017 25.12.2017 01.01.2018 08.01.2018 15.01.2018 22.01.2018 29.01.2018 05.02.2018 12.02.2018 19.02.2018 26.02.2018 05.03.2018 12.03.2018 19.03.2018 26.03.2018 02.04.2018 09.04.2018 16.04.2018 23.04.2018 30.04.2018 07.05.2018 14.05.2018 21.05.2018 28.05.2018 04.06.2018 11.06.2018 18.06.2018 25.06.2018 02.07.2018 09.07.2018 16.07.2018 23.07.2018 30.07.2018 06.08.2018 13.08.2018 20.08.2018 27.08.2018 03.09.2018 10.09.2018 63.66 65.71 64.18 59.41 N/A 63.81 62.49 61.35 62.01 65.49 63.05 63.4 66.23 67.61 68.56 70.74 71.01 72.26 N/A 64.76 66.1 65.91 69.91 73.89 73.93 68.22 67.9 71.19 69.01 67.25 66.5 69.97 N/A 67.55 2.901 2.903 2.973 2.996 3.028 3.025 3.07 3.086 3.063 3.027 3.007 2.992 2.976 2.972 3.01 3.042 3.043 3.104 3.133 3.157 3.171 3.239 3.277 3.288 3.285 3.266 3.244 3.216 3.236 3.243 3.239 3.22 3.226 3.223 3.217 3.207 3.226 3.252 3.258 Diesel $/gal Date WTI 02.01.2017 09.01.2017 51.96 16.01.2017 N/A 23.01.2017 52.75 30.01.2017 52.63 06.02.2017 53.01 13.02.2017 52.9 20.02.2017 N/A 27.02.2017 54.05 06.03.2017 53.2 13.03.2017 48.4 20.03.2017 48.22 27.03.2017 47.73 03.04.2017 50.24 10.04.2017 53.08 17.04.2017 52.65 24.04.2017 49.23 01.05.2017 48.84 08.05.2017 46.43 15.05.2017 48.85 22.05.2017 50.73 29.05.2017 NA 05.06.2017 47.4 12.06.2017 46.08 19.06.2017 44.2 26.06.2017 43.38 03.07.2017 47.04 10.07.2017 44.4 17.07.2017 46.02 24.07.2017 46.34 31.07.2017 50.17 07.08.2017 49.39 14.08.2017 47.59 21.08.2017 47.37 28.08.2017 46.57 04.09.2017 N/A 11.09.2017 48.06 18.09.2017 49.88 25.09.2017 51.85 02.10.2017 50.59 09.10.2017 49.58 16.10.2017 51.86 23.10.2017 51.91 30.10.2017 54.11 06.11.2017 57.34 13.11.2017 56.77 20.11.2017 56.21 27.11.2017 58.1 04.12.2017 57.48 11.12.2017 57.84 2.597 2.585 2.569 2.562 2.558 2.565 2.572 2.577 2.579 2.564 2.539 2.532 2.556 2.582 2.597 2.595 2.583 2.565 2.544 2.539 2.571 2.564 2.524 2.489 2.465 2.472 2.481 2.491 2.507 2.531 2.581 2.598 2.596 2.605 2.758 2.802 2.791 2.788 2.792 2.776 2.787 2.797 2.819 2.882 2.915 2.912 2.926 2.922 2.91 57.17 N/A N/A 61.73 N/A 18.12.2017 25.12.2017 01.01.2018 08.01.2018 15.01.2018 22.01.2018 29.01.2018 05.02.2018 12.02.2018 19.02.2018 26.02.2018 05.03.2018 12.03.2018 19.03.2018 26.03.2018 02.04.2018 09.04.2018 16.04.2018 23.04.2018 30.04.2018 07.05.2018 14.05.2018 21.05.2018 28.05.2018 04.06.2018 11.06.2018 18.06.2018 25.06.2018 02.07.2018 09.07.2018 16.07.2018 23.07.2018 30.07.2018 06.08.2018 13.08.2018 20.08.2018 27.08.2018 03.09.2018 10.09.2018 63.66 65.71 64.18 59.41 N/A 63.81 62.49 61.35 62.01 65.49 63.05 63.4 66.23 67.61 68.56 70.74 71.01 72.26 N/A 64.76 66.1 65.91 69.91 73.89 73.93 68.22 67.9 71.19 69.01 67.25 66.5 69.97 N/A 67.55 2.901 2.903 2.973 2.996 3.028 3.025 3.07 3.086 3.063 3.027 3.007 2.992 2.976 2.972 3.01 3.042 3.043 3.104 3.133 3.157 3.171 3.239 3.277 3.288 3.285 3.266 3.244 3.216 3.236 3.243 3.239 3.22 3.226 3.223 3.217 3.207 3.226 3.252 3.258
Step by Step Solution
There are 3 Steps involved in it

Get step-by-step solutions from verified subject matter experts