

Question: a.Computer 3-months moving average of this demand. Does this series still show seasonal variation. b. Compute 12-months moving average of this demand. c. Plot the
a.Computer 3-months moving average of this demand. Does this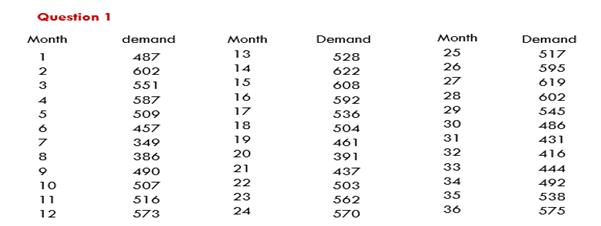
series still show seasonal variation.
b. Compute 12-months moving average of this demand.
c. Plot the original data and two moving average and interpret the result.
Make sure you show the calculations to explain the answers.
Question 1 Month demand Month Demand Month Demand 487 13 528 25 517 602 14 622 26 595 3 551 15 608 27 619 16 28 602 587 592 509 17 536 29 545 457 18 504 30 486 349 19 461 31 431 386 20 391 32 416 490 21 437 33 444 10 507 22 503 34 492 23 35 538 11 516 562 24 36 575 12 573 570
Step by Step Solution
3.42 Rating (158 Votes )
There are 3 Steps involved in it
To address the question lets calculate the 3month and 12month moving averages then plot the data to ... View full answer

Get step-by-step solutions from verified subject matter experts