

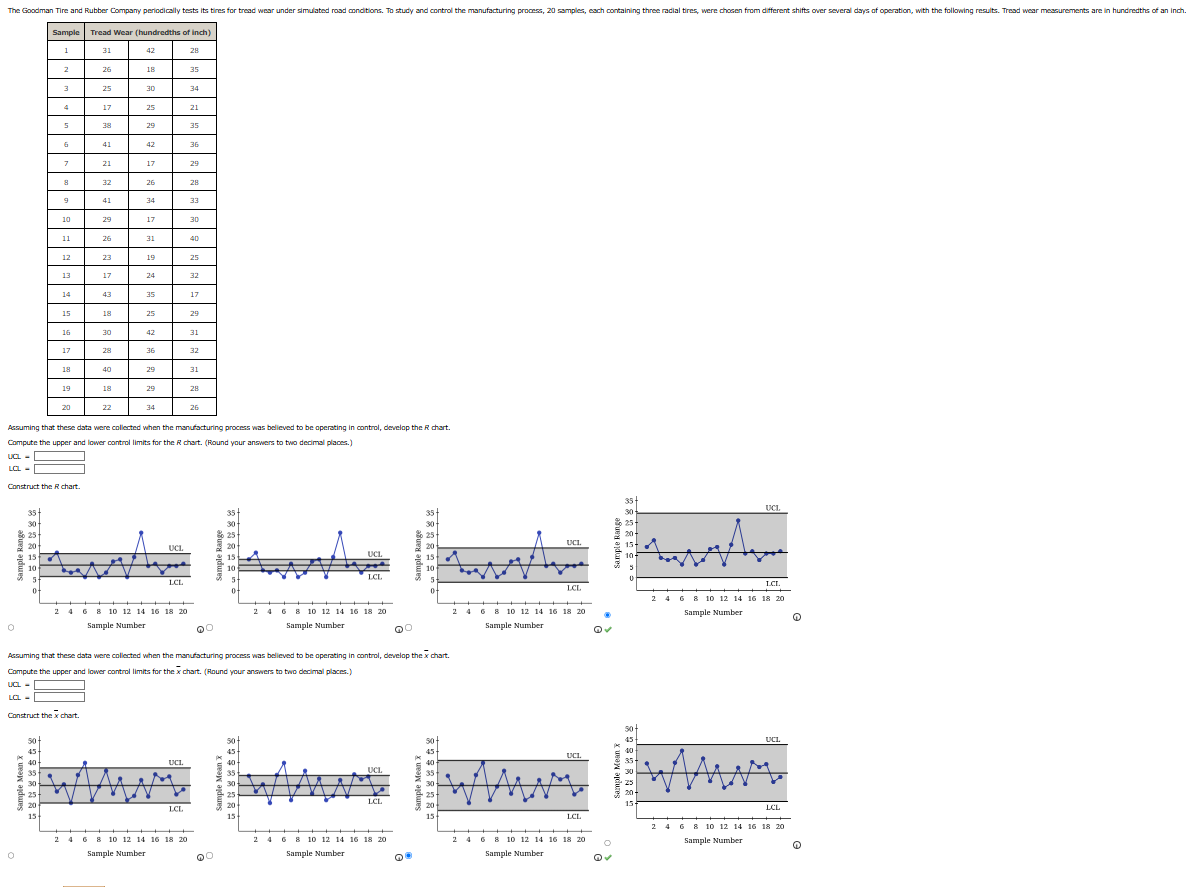
Question: Acsuming that these data were collected when the manufacturing process was believed t o b e aperating i n control, develap the R chart. Compute
Acsuming that these data were collected when the manufacturing process was believed aperating control, develap the chart.
Compute the upper and lower control for the chart. your answers two decimal places.
Construct the chart.
Assuming that these data were collected when the manufocturing process was believed aperating control, develap the chart.
Compute the upper and lower control for the your anawers two decimal ploces.
uCl.
:
Step by Step Solution
There are 3 Steps involved in it
1 Expert Approved Answer
Step: 1 Unlock

Question Has Been Solved by an Expert!
Get step-by-step solutions from verified subject matter experts
Step: 2 Unlock
Step: 3 Unlock