

Question: Activity 1: Graph and interpret motion data of a moving object One way to analyze the motion of an object is to graph the
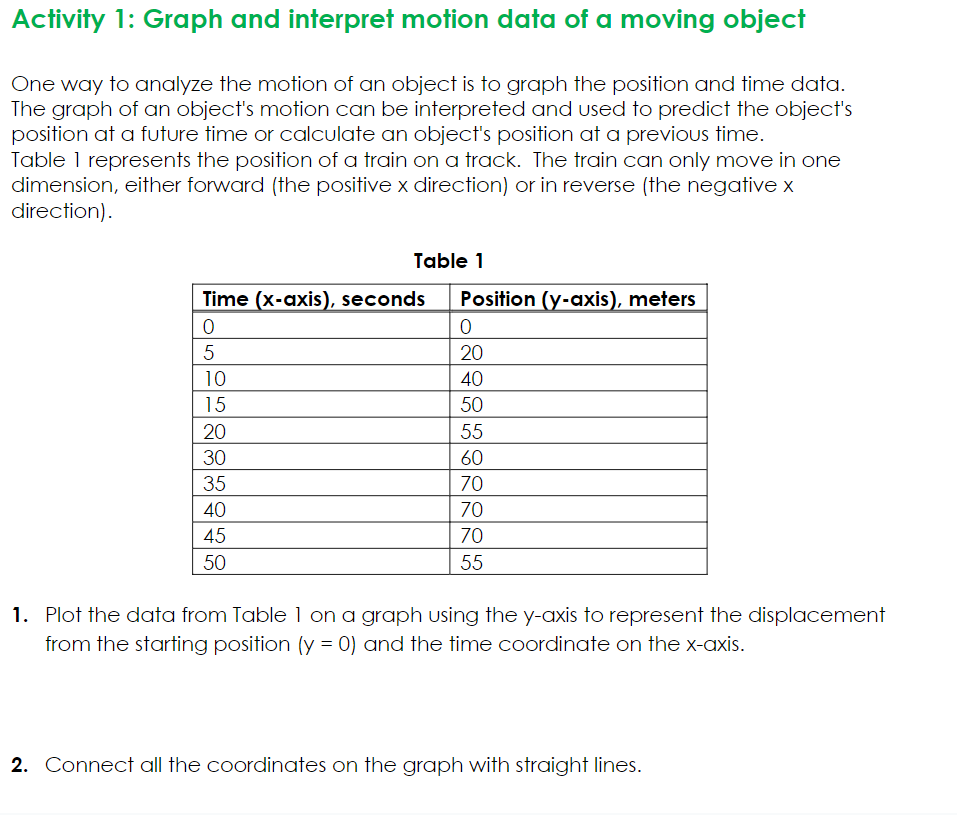
Activity 1: Graph and interpret motion data of a moving object One way to analyze the motion of an object is to graph the position and time data. The graph of an object's motion can be interpreted and used to predict the object's position at a future time or calculate an object's position at a previous time. Table 1 represents the position of a train on a track. The train can only move in one dimension, either forward (the positive x direction) or in reverse (the negative x direction). Table 1 Time (x-axis), seconds Position (y-axis), meters 0 0 5 20 10 40 15 50 20 55 30 60 35 70 40 70 45 70 50 55 1. Plot the data from Table 1 on a graph using the y-axis to represent the displacement from the starting position (y = 0) and the time coordinate on the x-axis. 2. Connect all the coordinates on the graph with straight lines. Label (y-axis): Label (x-axis):
Step by Step Solution
There are 3 Steps involved in it

Get step-by-step solutions from verified subject matter experts