

Question: Activity 1 Instructions: (1) Solve the problems given below. (2) Present a neat and orderly solution 1. The following data represent the amount in pesos

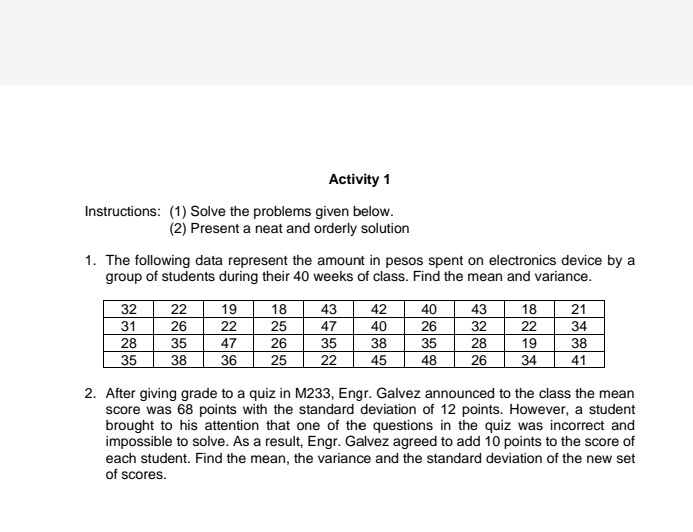
Activity 1 Instructions: (1) Solve the problems given below. (2) Present a neat and orderly solution 1. The following data represent the amount in pesos spent on electronics device by a group of students during their 40 weeks of class. Find the mean and variance. 32 22 19 18 43 42 40 43 18 21 31 26 22 25 47 40 26 32 22 34 28 35 47 26 35 38 35 28 19 38 35 38 36 25 22 45 48 26 34 41 2. After giving grade to a quiz in M233, Engr. Galvez announced to the class the mean score was 68 points with the standard deviation of 12 points. However, a student brought to his attention that one of the questions in the quiz was incorrect and impossible to solve. As a result, Engr. Galvez agreed to add 10 points to the score of each student. Find the mean, the variance and the standard deviation of the new set of scores
Step by Step Solution
There are 3 Steps involved in it

Get step-by-step solutions from verified subject matter experts