

Question: ACTIVITY 1: Organization and Presentation Figure 1: Frequency Polygon/Line Graph of the Age of Patients in a Hospital 25 20 15 Frequency 10 5 0
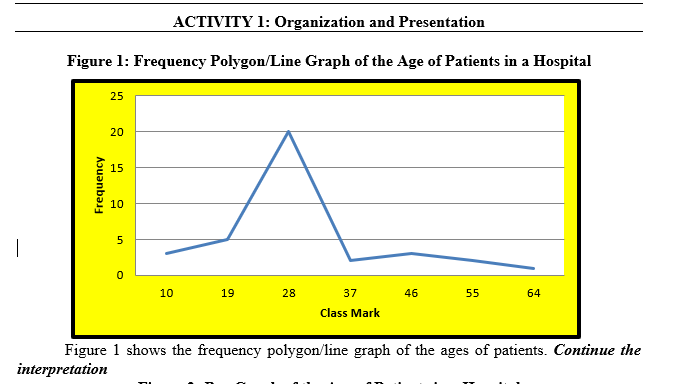
ACTIVITY 1: Organization and Presentation Figure 1: Frequency Polygon/Line Graph of the Age of Patients in a Hospital 25 20 15 Frequency 10 5 0 10 19 28 37 46 55 64 Class Mark Figure 1 shows the frequency polygon/line graph of the ages of patients. Continue the interpretation
Step by Step Solution
There are 3 Steps involved in it
1 Expert Approved Answer
Step: 1 Unlock

Question Has Been Solved by an Expert!
Get step-by-step solutions from verified subject matter experts
Step: 2 Unlock
Step: 3 Unlock