

Question: Activity 2: Try it yourself Try to repeat what we have done using this table X Pixi 0.75 0.25 V. SYNTHESIS: If random samples of
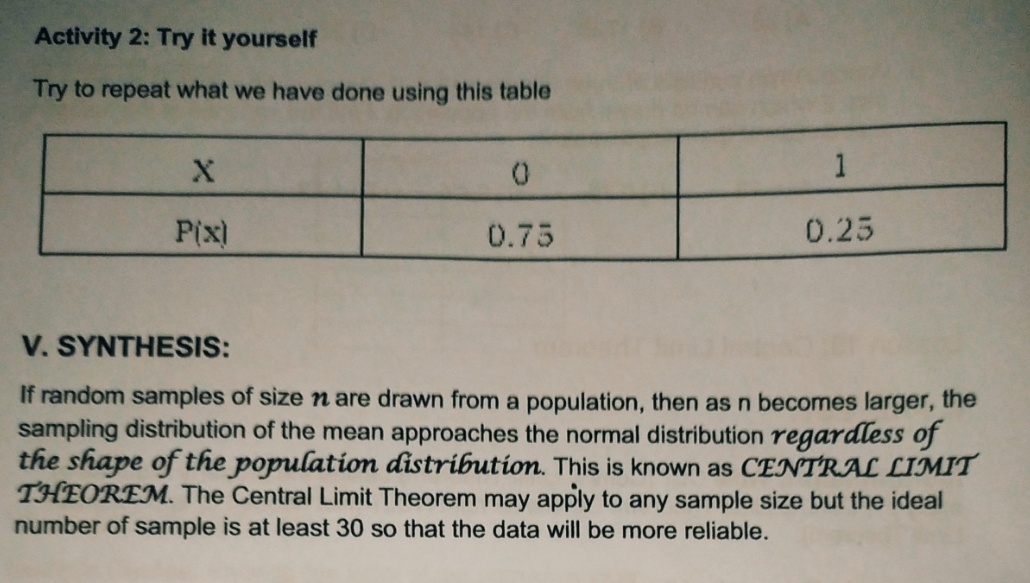
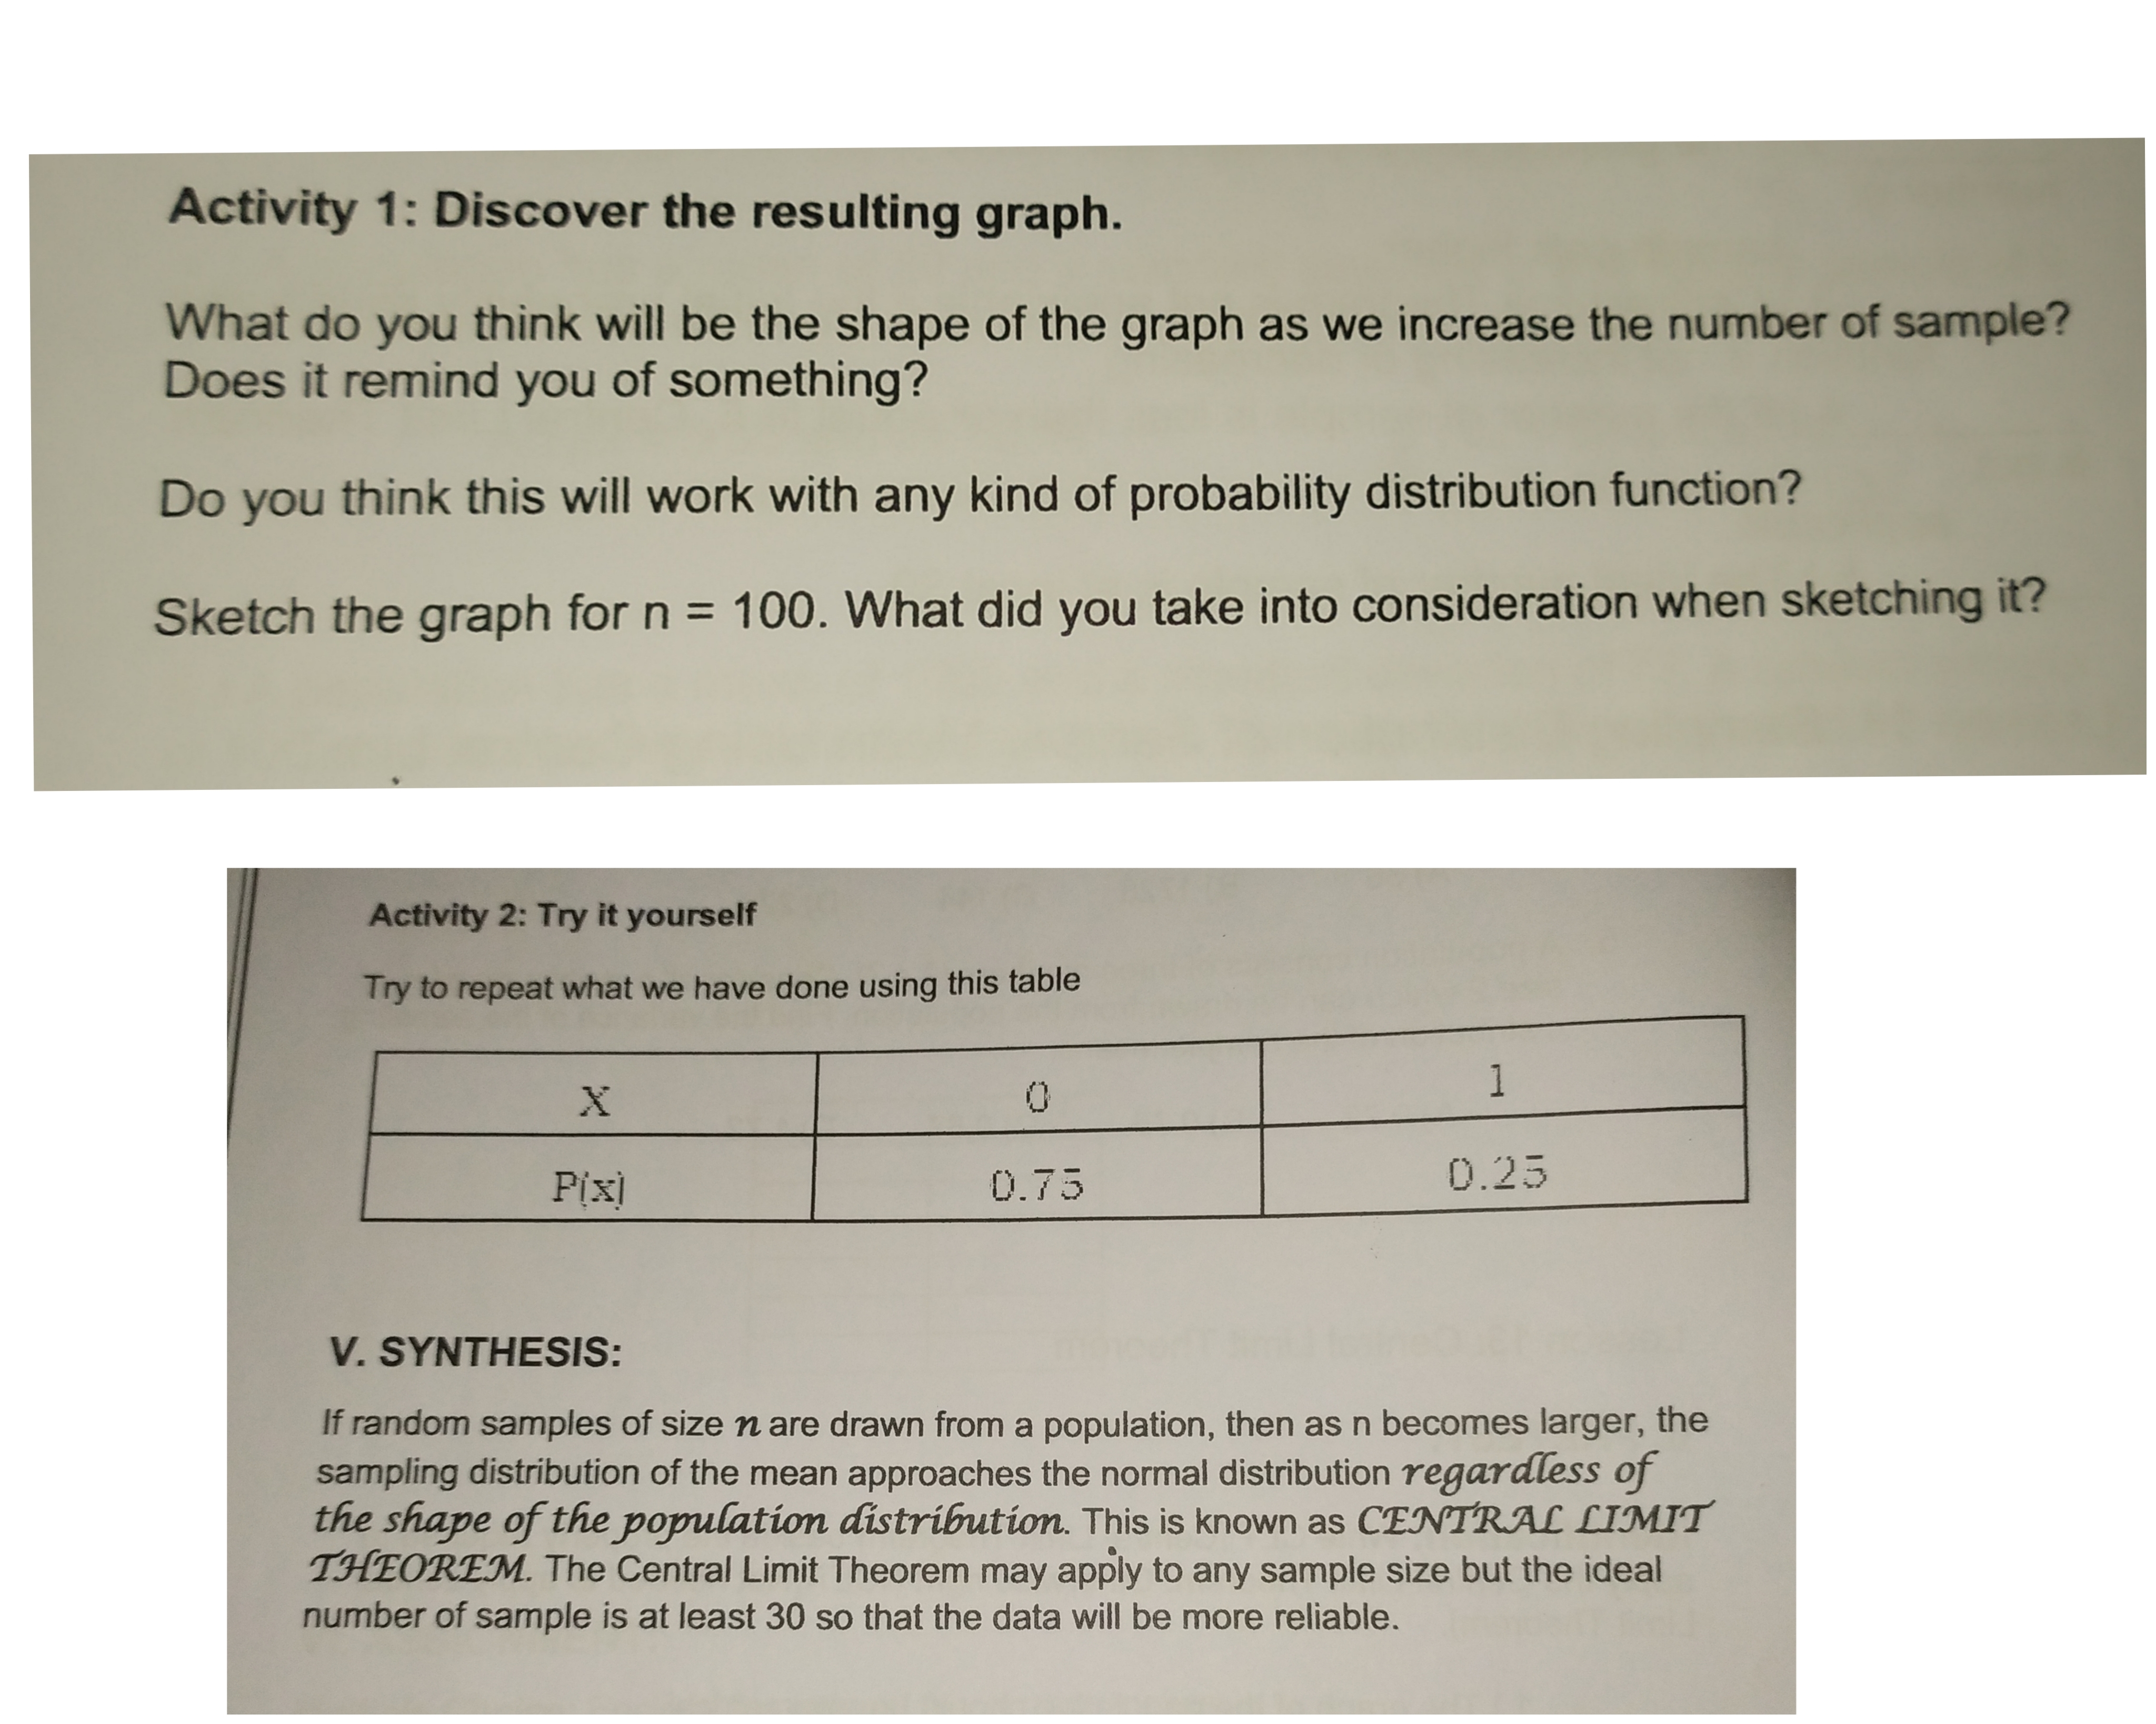
Activity 2: Try it yourself Try to repeat what we have done using this table X Pixi 0.75 0.25 V. SYNTHESIS: If random samples of size n are drawn from a population, then as n becomes larger, the sampling distribution of the mean approaches the normal distribution regardless of the shape of the population distribution. This is known as CENTRAL LIMIT THEOREM. The Central Limit Theorem may apply to any sample size but the ideal number of sample is at least 30 so that the data will be more reliable.Activity 1: Discover the resulting graph. What do you think will be the shape of the graph as we increase the number of sample? Does it remind you of something? Do you think this will work with any kind of probability distribution function? Sketch the graph for n = 100. What did you take into consideration when sketching it? Activity 2: Try it yourself Try to repeat what we have done using this table X O 1 Pixi 0.75 0.25 V. SYNTHESIS: If random samples of size n are drawn from a population, then as n becomes larger, the sampling distribution of the mean approaches the normal distribution regardless of the shape of the population distribution. This is known as CENTRAL LIMIT THEOREM. The Central Limit Theorem may apply to any sample size but the ideal number of sample is at least 30 so that the data will be more reliable
Step by Step Solution
There are 3 Steps involved in it

Get step-by-step solutions from verified subject matter experts