

Question: Activity 3: Show plot of Pressure vs. N. Make sure you include the Temperature information, legend, axes labels with correct unit, title of the
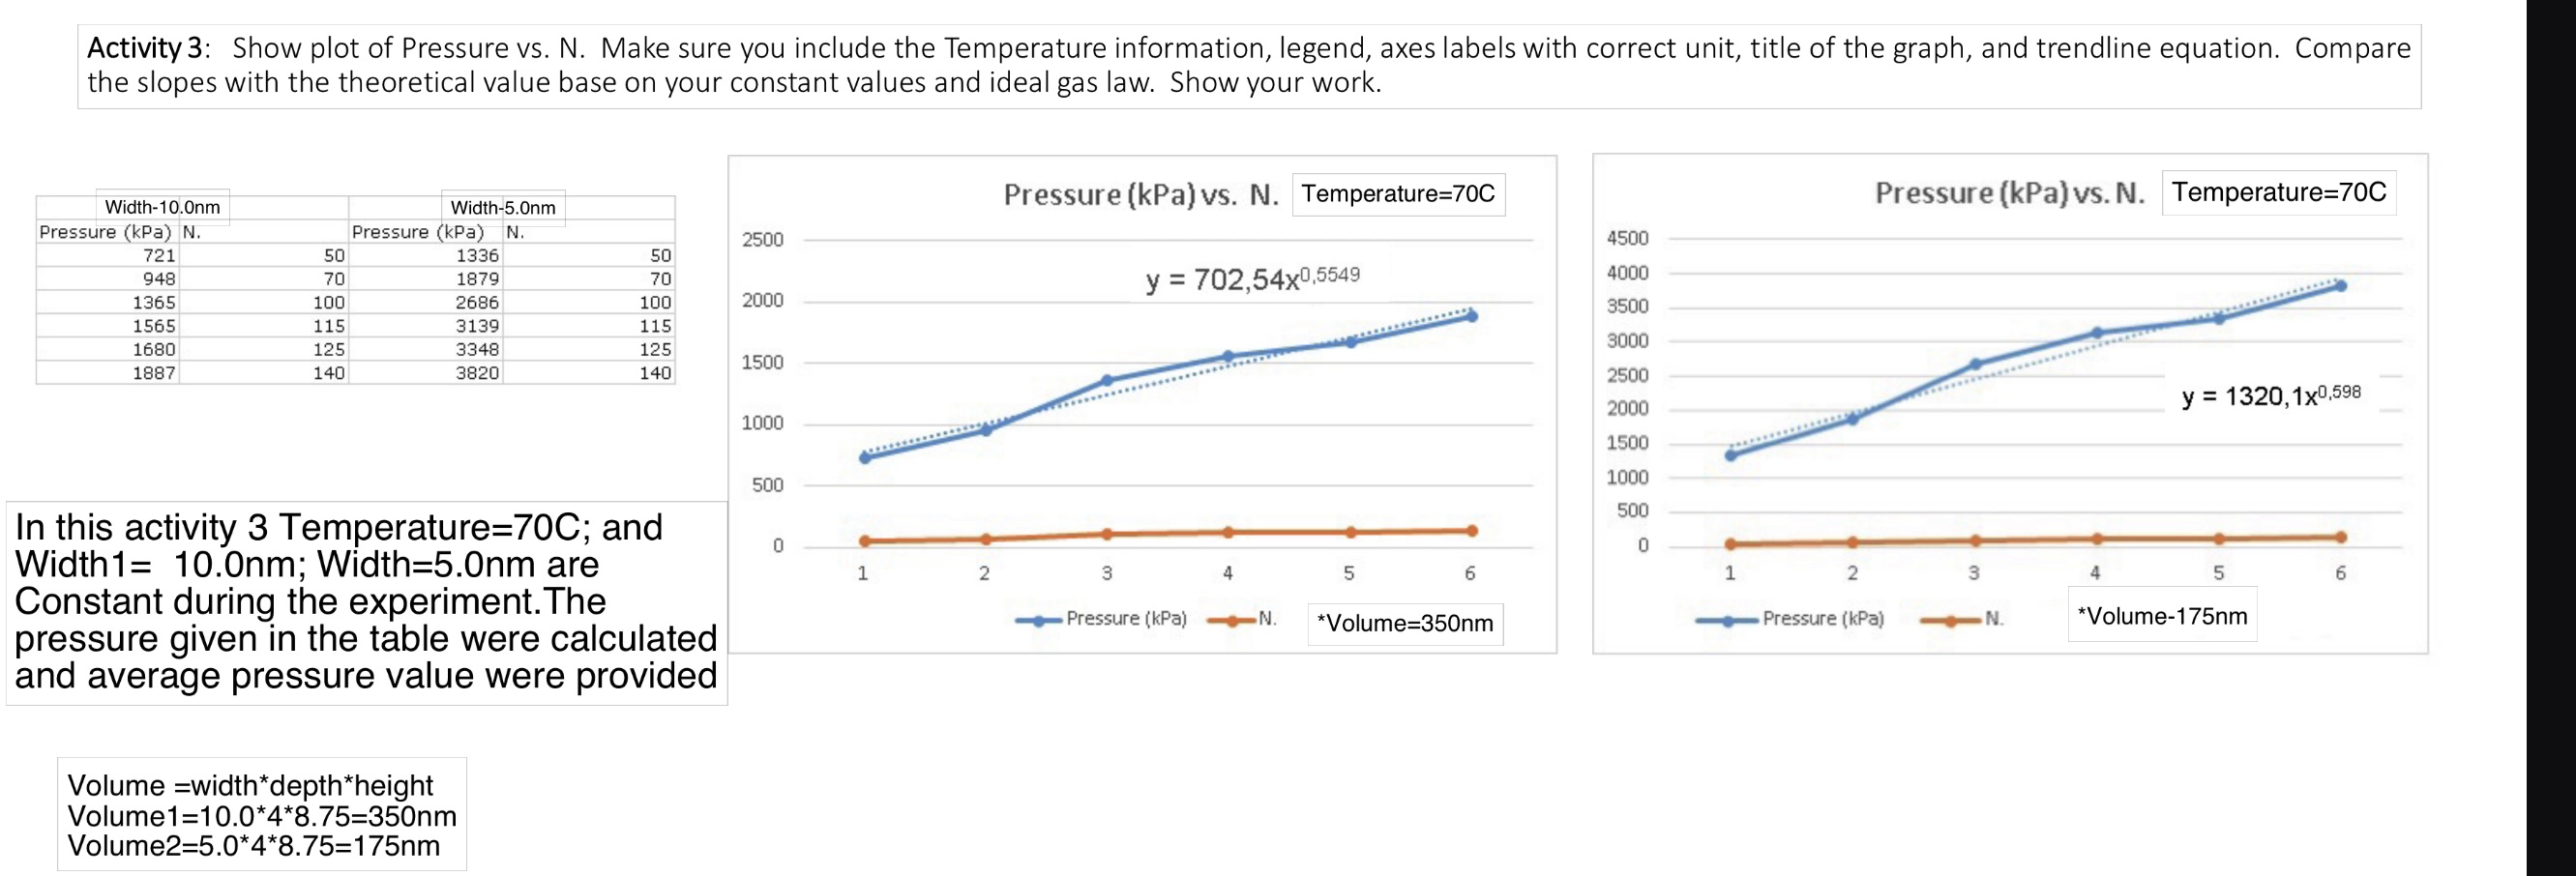
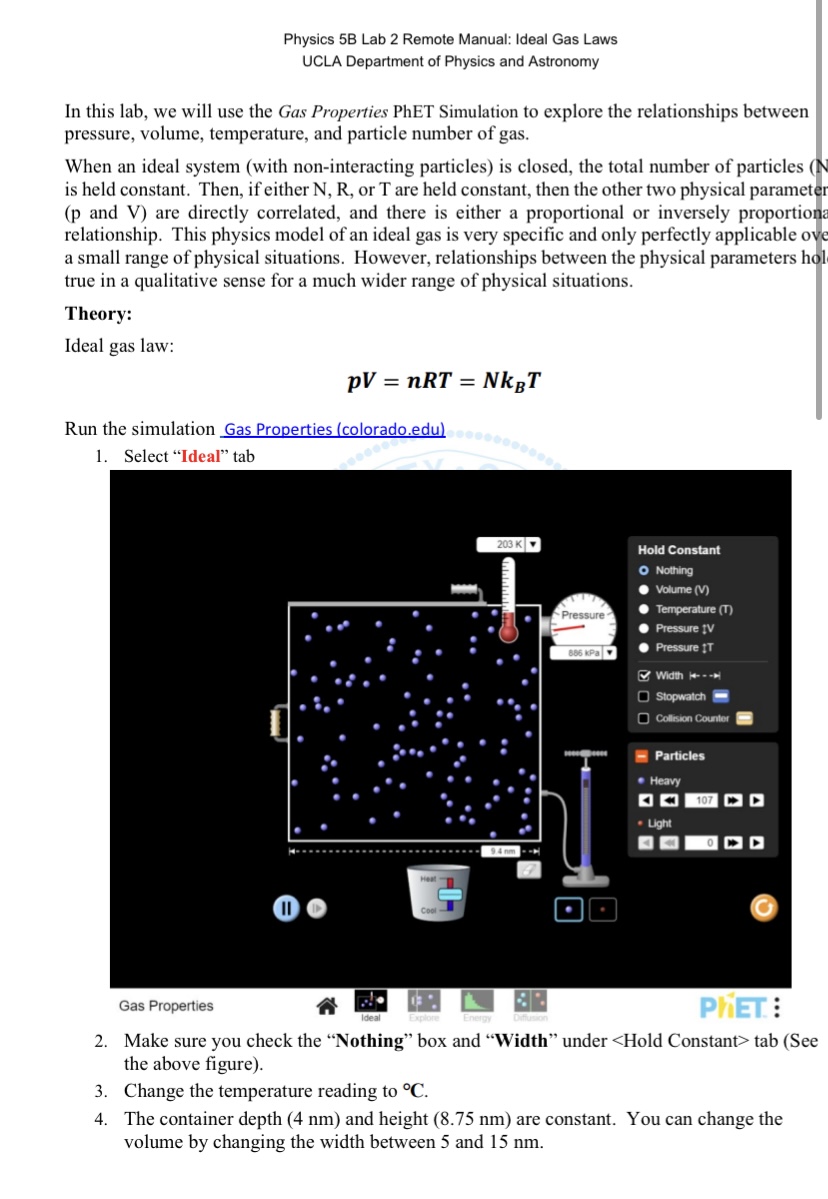
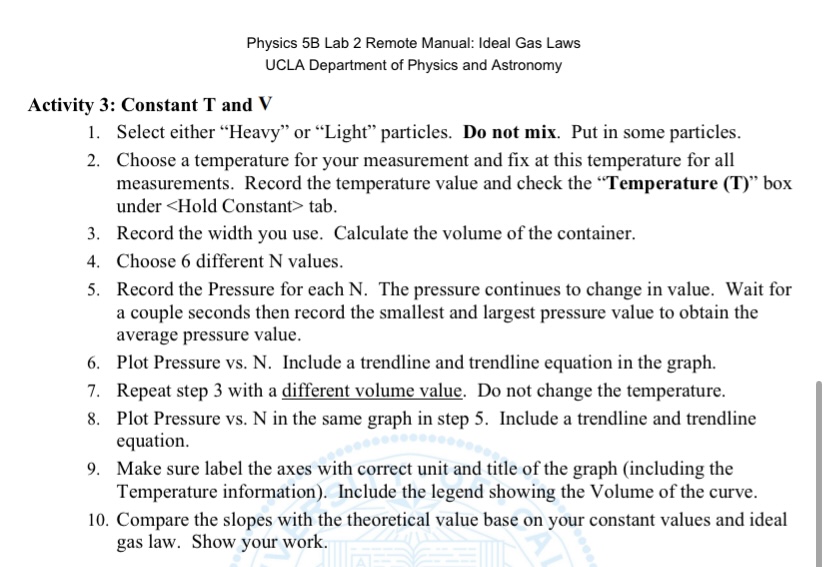
Activity 3: Show plot of Pressure vs. N. Make sure you include the Temperature information, legend, axes labels with correct unit, title of the graph, and trendline equation. Compare the slopes with the theoretical value base on your constant values and ideal gas law. Show your work. Width-10.0nm Width-5.0nm Pressure (kPa) N. 721 Pressure (kPa) N. 2500 50 1336 50 948 70 1879 70 1365 100 2686 100 2000 1565 115 3139 115 1680 125 3348 125 1500 1887 140 3820 140 In this activity 3 Temperature=70C; and Width1= 10.0nm; Width=5.0nm are Constant during the experiment. The pressure given in the table were calculated and average pressure value were provided Volume width*depth*height Volume1=10.0*4*8.75=350nm Volume2=5.0*4*8.75=175nm Pressure (kPa) vs. N. Temperature=70C Pressure (kPa) vs. N. Temperature=70C 4500 y = 702,54x0,5549 4000 3500 3000 2500 2000 y=1320,1x0,598 1000 1500 1000 500 500 0 1 2 3 0 Pressure (kPa) 4 5 N. 6 1 2 3 4 5 6 *Volume=350nm Pressure (kPa) N. *Volume-175nm Physics 5B Lab 2 Remote Manual: Ideal Gas Laws UCLA Department of Physics and Astronomy In this lab, we will use the Gas Properties PhET Simulation to explore the relationships between pressure, volume, temperature, and particle number of gas. When an ideal system (with non-interacting particles) is closed, the total number of particles (N is held constant. Then, if either N, R, or T are held constant, then the other two physical parameter (p and V) are directly correlated, and there is either a proportional or inversely proportion relationship. This physics model of an ideal gas is very specific and only perfectly applicable ove a small range of physical situations. However, relationships between the physical parameters hol true in a qualitative sense for a much wider range of physical situations. Theory: Ideal gas law: pV = nRT = NkT Run the simulation Gas Properties (colorado.edu) 1. Select "Ideal" tab II Cool 203 K Pressure 886 kPa Hold Constant O Nothing Volume (V) Temperature (T) Pressure V Pressure T Width -- Stopwatch Collision Counter Particles Heavy Light 107 Gas Properties Ideal Explore Energy Diffusion PHET 2. Make sure you check the "Nothing" box and "Width" under tab (See the above figure). 3. Change the temperature reading to C. 4. The container depth (4 nm) and height (8.75 nm) are constant. You can change the volume by changing the width between 5 and 15 nm. Physics 5B Lab 2 Remote Manual: Ideal Gas Laws UCLA Department of Physics and Astronomy Activity 3: Constant T and V 1. Select either "Heavy" or "Light" particles. Do not mix. Put in some particles. 2. Choose a temperature for your measurement and fix at this temperature for all measurements. Record the temperature value and check the "Temperature (T)" box under tab. 3. Record the width you use. Calculate the volume of the container. 4. Choose 6 different N values. 5. Record the Pressure for each N. The pressure continues to change in value. Wait for a couple seconds then record the smallest and largest pressure value to obtain the average pressure value. 6. Plot Pressure vs. N. Include a trendline and trendline equation in the graph. 7. Repeat step 3 with a different volume value. Do not change the temperature. 8. Plot Pressure vs. N in the same graph in step 5. Include a trendline and trendline equation. 9. Make sure label the axes with correct unit and title of the graph (including the Temperature information). Include the legend showing the Volume of the curve. 10. Compare the slopes with the theoretical value base on your constant values and ideal gas law. Show your work.
Step by Step Solution
There are 3 Steps involved in it

Get step-by-step solutions from verified subject matter experts