

Question: Activity 4: Linear regression and census data An individual activity Purpose: To use linear regression to explore relationships between paired values Background: Data about women's
Activity 4: Linear regression and census data An individual activity Purpose: To use linear regression to explore relationships between paired values Background: Data about women's educational attainment and marriage age from 2011 to 2019 is given in a table below. We'll explore the connections between those 2 data sets. Part 1 - Make Predictions 1. Without looking at the data set yet: between 2011 and 2019 in the United States, do you think the percentage of women aged 25-34 with a bachelor's degree or higher increased, decreased, or stayed the same? Explain your reasoning. 2. During the same period in the United States, do you think the median age of women when they were first married increased, decreased, or stayed the same? Explain your reasoning. 3. Make a conjecture predicting whether a relationship exists between the variables. 4. If you predicted a relationship in question 3, state its direction: Do you think there will be higher percentages of women with bachelor's degrees during years with higher or lower median ages of women when they were first married? (this is, do they rise together, or oppositely) Why?
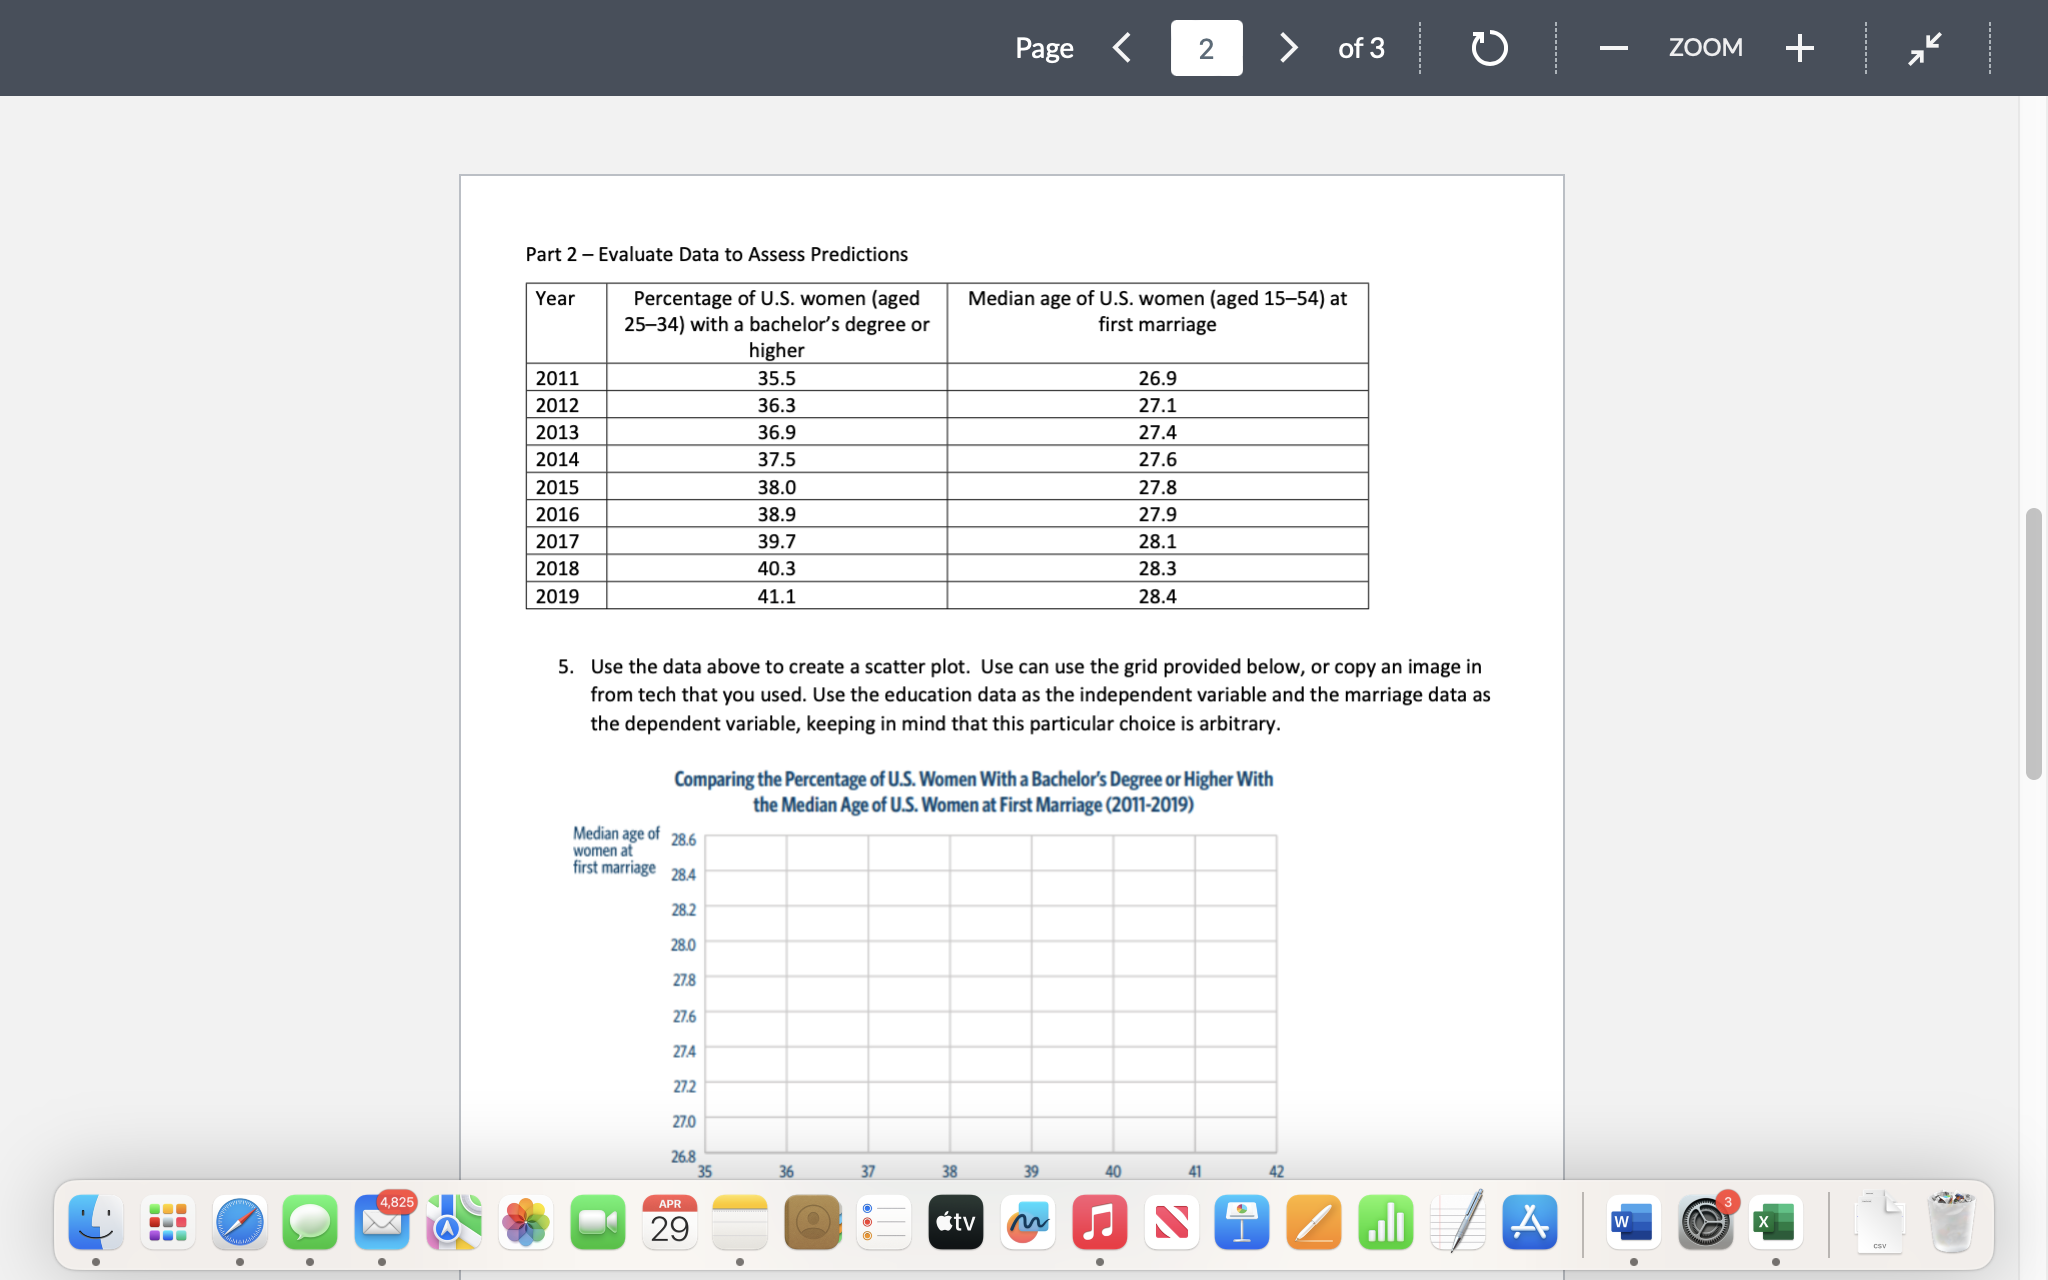
Part 2 - Evaluate Data to Assess Predictions Year Percentage of U.S. women (aged Median age of U.S. women (aged 15-54) at 25-34) with a bachelor's degree or first marriage higher 2011 35.5 26.9 2012 36.3 271 2013 36.9 27.4 2014 37.5 276 2015 38.0 27.8 2016 38.9 279 2017 39.7 28.1 2018 40.3 28.3 2019 41.1 28.4 5. Use the data above to create a scatter plot. Use can use the grid provided below, or copy an image in from tech that you used. Use the education data as the independent variable and the marriage data as the dependent variable, keeping in mind that this particular choice is arbitrary. Comparing the Percentage of U.S. Women With a Bachelor's Degree or Higher With the Median Age of U.S. Women at First Marriage (2011-2019) Median age of g4 women at first marriage 84 282 280 28 26 274 22 20 36 k1) 38 s .. @ S ssn [ 14% T
Step by Step Solution
There are 3 Steps involved in it

Get step-by-step solutions from verified subject matter experts