

Question: Activity 4: Show plot of Pressure vs. Temperature. Make sure you include the particle information, legend, axes labels with correct unit, title of the
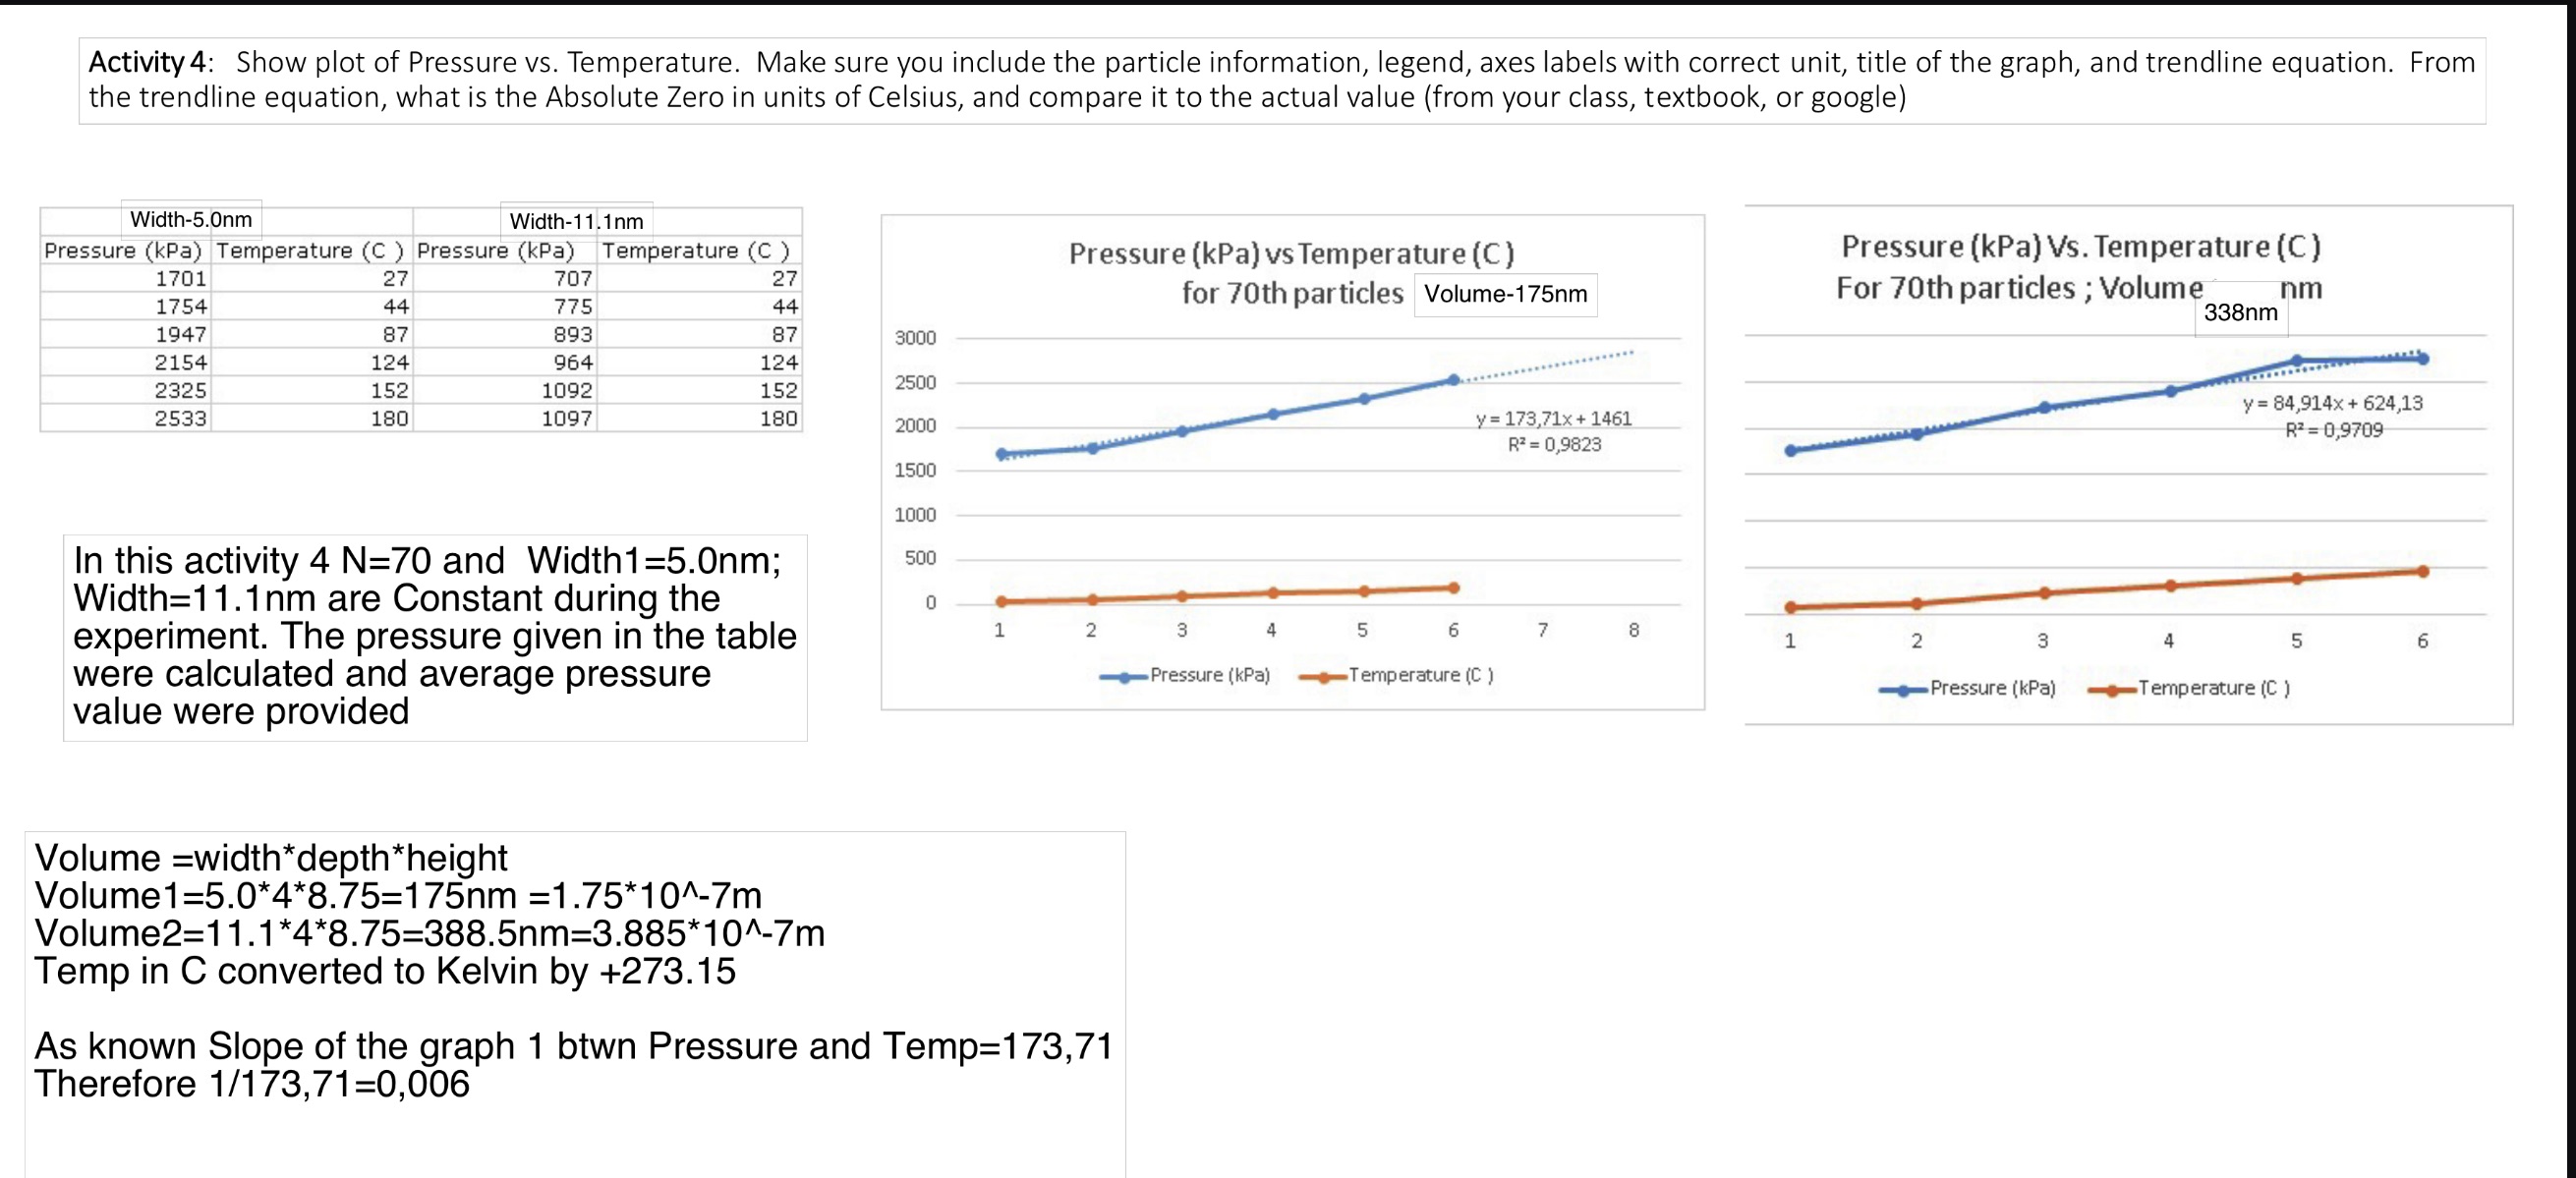
Activity 4: Show plot of Pressure vs. Temperature. Make sure you include the particle information, legend, axes labels with correct unit, title of the graph, and trendline equation. From the trendline equation, what is the Absolute Zero in units of Celsius, and compare it to the actual value (from your class, textbook, or google) Width-5.0nm Width-11.1nm Pressure (kPa) Temperature (C) Pressure (kPa) Temperature (C) 1701 27 707 27 1754 44 775 44 Pressure (kPa) vs Temperature (C) for 70th particles Volume-175nm Pressure (kPa) Vs. Temperature (C) For 70th particles; Volume nm 338nm 1947 87 893 87 3000 2154 124 964 124 2500 2325 152 1092 152 2533 180 1097 180 2000 y=173,71x+1461 R=0,9823 y= 84,914x+624,13 R=0,9709 9. 1500 1000 In this activity 4 N=70 and Width1=5.0nm; Width=11.1nm are Constant during the experiment. The pressure given in the table were calculated and average pressure value were provided 500 0 1 2 3 4 5 6 7 8 1 2 Pressure (kPa) Temperature (C) Pressure (kPa) 3 4 5 6 Temperature (C) Volume width*depth *height Volume1=5.0*4*8.75=175nm =1.75*10^-7m Volume2=11.1*4*8.75=388.5nm=3.885*10^-7m Temp in C converted to Kelvin by +273.15 As known Slope of the graph 1 btwn Pressure and Temp=173,71 Therefore 1/173,71=0,006
Step by Step Solution
There are 3 Steps involved in it

Get step-by-step solutions from verified subject matter experts