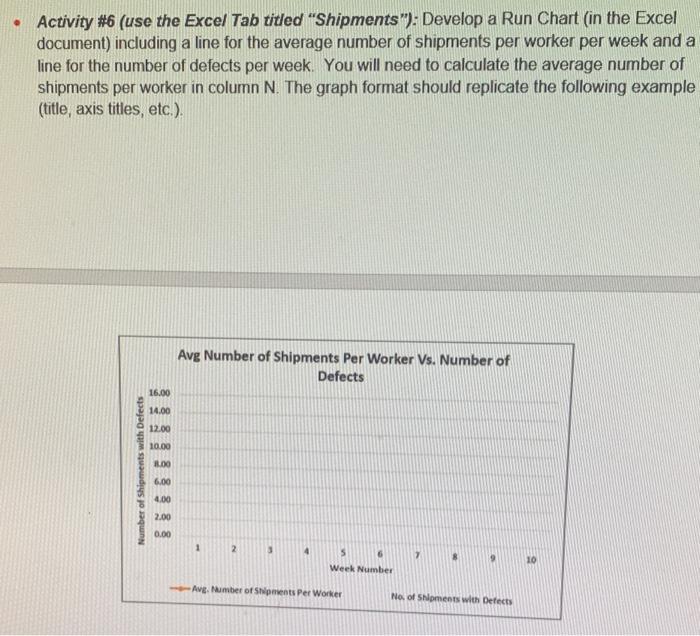
Question: - Activity #6 (use the Excel Tab titled Shipments): Develop a Run Chart (in the Excel document) including a line for the average number of

- Activity #6 (use the Excel Tab titled
- Activity #6 (use the Excel Tab titled "Shipments"): Develop a Run Chart (in the Excel document) including a line for the average number of shipments per worker per week and a line for the number of defects per week. You will need to calculate the average number of shipments per worker in column N. The graph format should replicate the following example (title, axis titles, etc.). \begin{tabular}{|c|c|c|c|c|c|} \hline & No. of New Week & No. of Hires & Total No. of Terminations & Workers & Avg. Number of Shipments Turnover Per Worker \\ \hline 1 & 1 & 0 & 20 & 1 & \\ \hline 2 & 2 & 1 & 21 & 3 & \\ \hline 3 & 3 & 2 & 22 & 5 & \\ \hline 4 & 2 & 0 & 23 & 2 & \\ \hline 5 & 1 & 2 & 25 & 3 & \\ \hline 6 & 1 & 4 & 24 & 5 & \\ \hline 7 & 2 & 1 & 21 & 3 & \\ \hline 8 & 1 & 2 & 22 & 3 & \\ \hline 9 & 1 & 1 & 21 & 2 & \\ \hline 10 & 1 & 2 & 21 & 3 & \\ \hline \end{tabular}

Step by Step Solution

There are 3 Steps involved in it

1 Expert Approved Answer
Step: 1 Unlock blur-text-image
Question Has Been Solved by an Expert!

Get step-by-step solutions from verified subject matter experts

Step: 2 Unlock
Step: 3 Unlock

Students Have Also Explored These Related General Management Questions!