

Question: Activity 7: We know that the wide-spread and effective integration of technology in to instruction requires many resources and supports; it is not a simple
Activity 7:
We know that the wide-spread and effective integration of technology in to instruction requires many resources and supports; it is not a simple or easy-to-achieve goal. ISTE has identified fourteen critical conditions which must be present to support a successful instructional technology initiative. Instructional technology professional development is, at its best, driven by the needs of the school. ISTE's Lead & Transform Diagnostic Tool is a survey that can help you determine the conditions that your school has met and those that still need attention. With a clear vision for the individual conditions that must be met, this tool can help steer your school toward that vision. For our purposes, we will use this tool to discover needs as they relate to professional knowledge and learning. The survey is a bit lengthy, but will give you and your colleagues a valuable 'snapshot' of your school that can help inform professional development and technology infrastructure planning. Because ISTE no longer provides the online version, you will use the document posted in Moodle to conduct your needs analysis.
You should take this survey and find at least three of your colleagues (more would be better) who will take the survey. Once they have completed the survey, ask them to forward their results to you. You should then aggregate the data by compiling their reports in to one document and then summarize your school's readiness in each area. Your general steps are:
- Become familiar with the Essential Conditions.
- Preview the Lead & Transform Diagnostic Tool(ISTE Survey Document) to familiarize yourself with the report and the sample survey question.
- sCompile these into one document for posting. You can paste into one Word document or create one PDF if you have the tools to do so. Please keep your teacher participants confidential. Do not post names.
- Using formulas/functions in a spreadsheet, aggregate and average the results from all of the surveys for each of the 14 areas and create a chart that represents your school's averages for each area. Note that not all values from this aggregate chart can be assigned readiness levels since we do not have the numeric ranges for each level; however, the aggregate chart will be useful for a relative comparison of the areas.
- The spreadsheet with your chart.
- For each area that indicates "Beginning" from the survey that you took, post a short analysis giving:
- the reason for the lower rating,
- steps you feel could be taken to raise the rating, and
- professional development implications for the rating.
Feel free to include an analysis of the "Approaching" areas if you like, though it is not required.
Reporting instructions:
For each of the 14 categories, determine the percentage (i.e. 25/39= 64%). Then, for each survey, use a spreadsheet to make table and its representative bar chart of the data from the 14 categories. (See example bar graph below)
Areas indicating 50% or below are to be classified as Beginning. Areas indicating 51% - 75% will be classified Approaching. Areas indicating 76%-100% will be classified as Meeting standards.
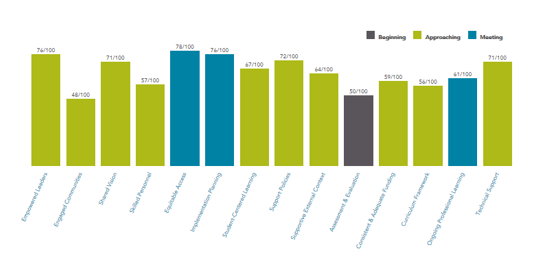
TENOO Empowered toadon Except Communtion Shared Vision Student-Centered teaming Support Action Beginning Approaching Consistent & Adequate Funding Mouting Technical Support
Step by Step Solution
There are 3 Steps involved in it

Get step-by-step solutions from verified subject matter experts