

Question: Activity C5: Misleading Graphs Name For full credit you must give a detailed solution. You should show your steps and/or explain your reasoning. You must

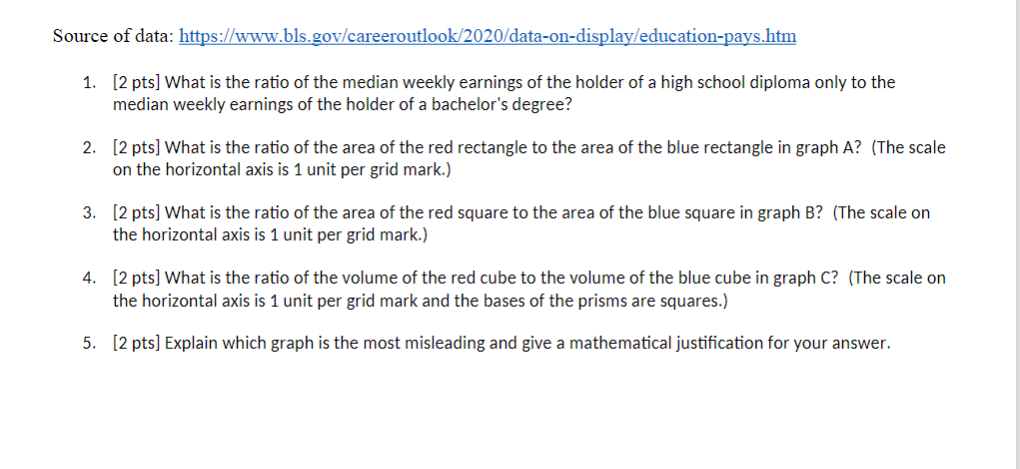
Activity C5: Misleading Graphs Name For full credit you must give a detailed solution. You should show your steps and/or explain your reasoning. You must put your name at the top of this page and use complete sentences when explaining. Part 1: Read this article https://www.statisticshowto.com/probability-and-statistics/descriptive-statistics/misleading-graphs/ https://www.statisticshowto.com/probability-and-statistics/descriptive-statistics/misleading-graphs/ Part 2: Review graphs A, B and C. Answer each question. Median Weekly Earnings Graph A Graph B $1500 $1500 $1250 $1250-+ $ 1250- 575D $ 1250 9 750 $500 $ 750 $ 500 $250 $250 HS Bachelor's HS Bachelors Diploma Degree Diploma Degree Graphic $190 $1250 1750 $1250 3750Source of data: https://www.bls.gov/careeroutlook/2020/data-on-display/education-pays.htm 1. [2 pts] What is the ratio of the median weekly earnings of the holder of a high school diploma only to the median weekly earnings of the holder of a bachelor's degree? [2 pts] What is the ratio of the area of the red rectangle to the area of the blue rectangle in graph A? (The scale on the horizontal axis is 1 unit per grid mark.) [2 pts] What is the ratio of the area of the red square to the area of the blue square in graph B? (The scale on the horizontal axis is 1 unit per grid mark.) [2 pts] What is the ratio of the volume of the red cube to the volume of the blue cube in graph C? (The scale on the horizontal axis is 1 unit per grid mark and the bases of the prisms are squares.) [2 pts] Explain which graph is the most misleading and give a mathematical justification for your
Step by Step Solution
There are 3 Steps involved in it

Get step-by-step solutions from verified subject matter experts