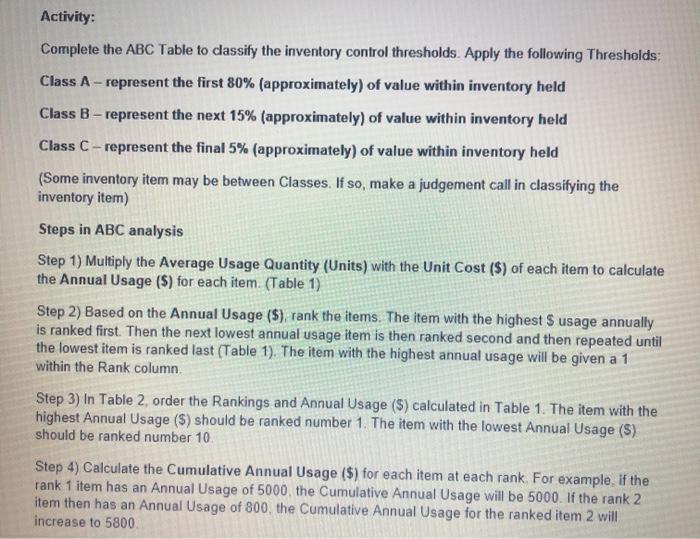
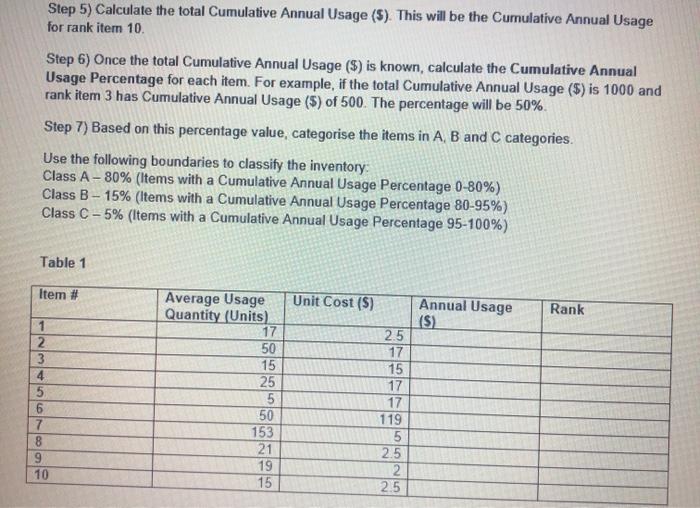
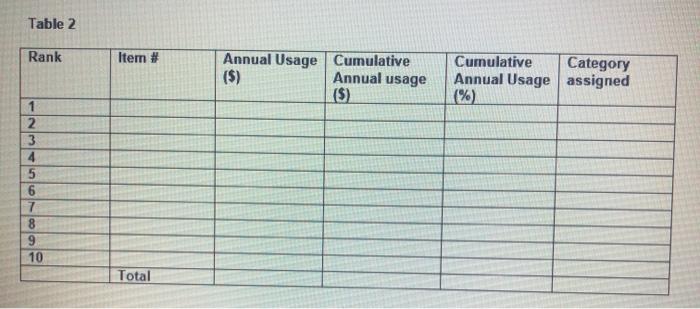
Question: Activity: Complete the ABC Table to classify the inventory control thresholds. Apply the following Thresholds: Class A - represent the first 80% (approximately) of value

Activity: Complete the ABC Table to classify the
Activity: Complete the ABC Table to classify the inventory control thresholds. Apply the following Thresholds: Class A - represent the first 80% (approximately) of value within inventory held Class B - represent the next 15% (approximately) of value within inventory held Class C-represent the final 5% (approximately) of value within inventory held (Some inventory item may be between Classes. If so, make a judgement call in classifying the inventory item) Steps in ABC analysis Step 1) Multiply the Average Usage Quantity (Units) with the Unit Cost (%) of each item to calculate the Annual Usage ($) for each item. (Table 1) Step 2) Based on the Annual Usage ($), rank the items. The item with the highest s usage annually is ranked first. Then the next lowest annual usage item is then ranked second and then repeated until the lowest item is ranked last (Table 1). The item with the highest annual usage will be given a 1 within the Rank column Step 3) In Table 2, order the Rankings and Annual Usage ($) calculated in Table 1. The item with the highest Annual Usage (5) should be ranked number 1. The item with the lowest Annual Usage (5) should be ranked number 10 Step 4) Calculate the Cumulative Annual Usage ($) for each item at each rank. For example, if the rank 1 item has an Annual Usage of 5000 the Cumulative Annual Usage will be 5000. If the rank 2 item then has an Annual Usage of 800, the Cumulative Annual Usage for the ranked item 2 will increase to 5800 Step 5) Calculate the total Cumulative Annual Usage (S). This will be the Cumulative Annual Usage for rank item 10 Step 6) Once the total Cumulative Annual Usage ($) is known, calculate the Cumulative Annual Usage Percentage for each item. For example, if the total Cumulative Annual Usage ($) is 1000 and rank item 3 has Cumulative Annual Usage (5) of 500. The percentage will be 50% Step 7) Based on this percentage value, categorise the items in A, B and C categories. Use the following boundaries to classify the inventory Class A - 80% (Items with a Cumulative Annual Usage Percentage 0-80%) Class B - 15% (Items with a Cumulative Annual Usage Percentage 80-95%) Class C-5% (items with a Cumulative Annual Usage Percentage 95-100%) Table 1 Item # Unit Cost (5) Rank 1 2 3 4 5 6 7 8 9 10 Average Usage Quantity (Units) 17 50 15 25 5 50 153 21 19 15 Annual Usage (S) 2.5 17 15 17 17 119 5 2.5 2. 2.5 Table 2 Rank Item # Annual Usage Cumulative ($) ($) Annual usage Cumulative Category Annual Usage assigned (%) 1 2 3 4 5 6 7 8 9 10 Total

Step by Step Solution

There are 3 Steps involved in it

1 Expert Approved Answer
Step: 1 Unlock blur-text-image
Question Has Been Solved by an Expert!

Get step-by-step solutions from verified subject matter experts

Step: 2 Unlock
Step: 3 Unlock

Students Have Also Explored These Related General Management Questions!