

Question: ACTIVITY Construct the scatter plot for the following data. Describe the relationship between the variables in terms of form. direction. and strength of associations. 1.
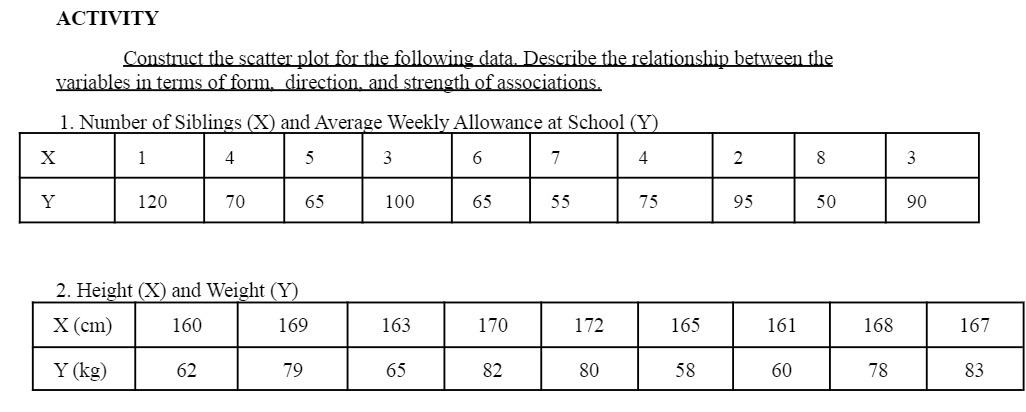
ACTIVITY Construct the scatter plot for the following data. Describe the relationship between the variables in terms of form. direction. and strength of associations. 1. Number of Siblings (X) and Average Weekly Allowance at School (Y) X 4 5 3 6 7 4 2 8 3 Y 120 70 65 100 65 55 75 95 50 90 2. Height (X) and Weight (Y) X (cm) 160 169 163 170 172 165 161 168 167 Y (kg) 62 79 65 82 80 58 60 78 83
Step by Step Solution
There are 3 Steps involved in it
1 Expert Approved Answer
Step: 1 Unlock

Question Has Been Solved by an Expert!
Get step-by-step solutions from verified subject matter experts
Step: 2 Unlock
Step: 3 Unlock