

Question: ACTIVITY: Right or Wrong, Make A Decision? Read and analyse each statement carefully and decide if the statement is right or wrong. Place a check
![a check mark [J] if the state-ent is true about the tdistribution](https://dsd5zvtm8ll6.cloudfront.net/si.experts.images/questions/2024/09/66ef0b7d5c3c3_07766ef0b7d4b302.jpg)
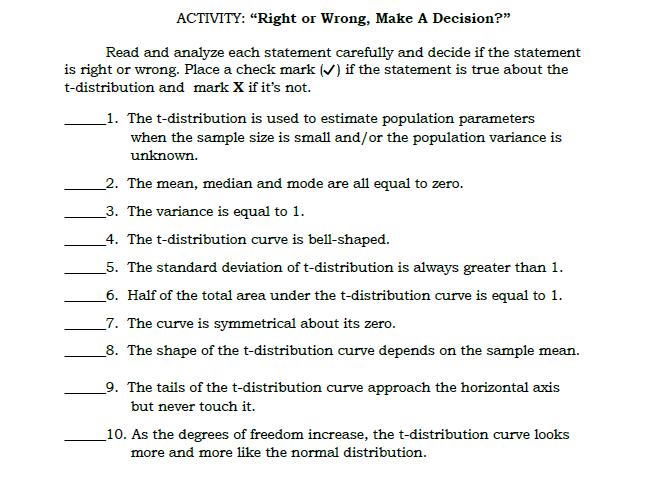
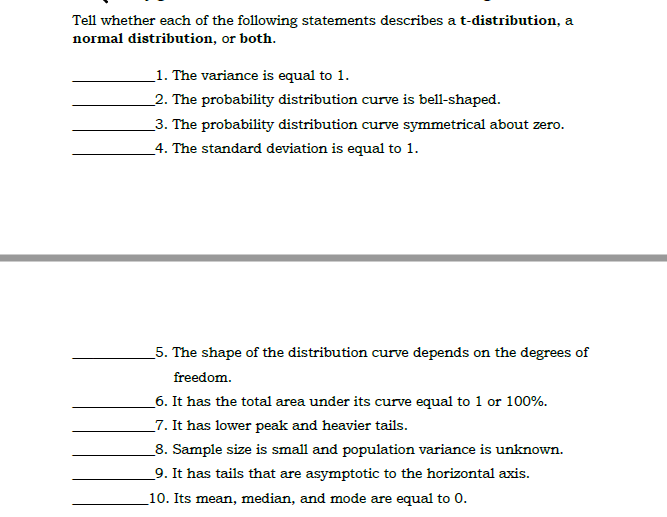
ACTIVITY: \"Right or Wrong, Make A Decision?\" Read and analyse each statement carefully and decide if the statement is right or wrong. Place a check mark [J] if the state-ent is true about the tdistribution and. mark X if it's not. 1. The tdistribution is used to estimate population parameters when the sample size is small andfor the population variance is unknown. M . The mean, median and mode are all equal to zero. DJ .Thevarianceisequalto 1. .p. . The tdistribution curve is bellshaped. U'I . The standard deviation of tdistribution is always greater than 1. F" Half of the total area under the tdisttibution curve is equal to 1. 5L: . The curve is symmetrical about its zero. OD . The shape of the tdistribution curve depends on the sample mean. 9. The tails of the t-dislzribution curve approach the horizontal axis but never touch it. It). ts the degrees of freedom increase, the tdistribution curve looks more and more like the normal distribution. Tell whether each of the following statements describes a t-distribution, a normal distribution, or both. 1. The variance is equal to 1. 2. The probability distribution curve is bell-shaped. 3. The probability distribution curve symmetrical about zero. 4. The standard deviation is equal to 1. 5. The shape of the distribution curve depends on the degrees of freedom. 6. It has the total area under its curve equal to 1 or 100%. 7. It has lower peak and heavier tails. 8. Sample size is small and population variance is unknown. 9. It has tails that are asymptotic to the horizontal axis. 10. Its mean, median, and mode are equal to 0.Fill in the blank with the correct word or phrase to complete each sentence. 1. The Student's tdistributicn is a probabilityr distribution that is used to estimate population parameters when the sample size is andfor when the is unknown. 2. The tdistributicn was developed by in 1938. 3. Like the normal distribution, the tdistribution is shaped, symmeh'ical about and has the total area under its curve equal to 4. The tdistribution has tails that are asymptotic to the axis. 5. The mean, median and mode of tdistribution are equal to E. The shape of the tdistribution curve depends on the number cf_. 'T. The tdistributicn has peak and tails than the normal curve. 8. As the degrees of freedom increase, the tdistributicn approaches to the distribution. 9. The variance and the standard deviation of the tdistribution is alwan than 1. It}. To compute for the degree of 'eedom, use the formula
Step by Step Solution
There are 3 Steps involved in it

Get step-by-step solutions from verified subject matter experts