

Question: Activity Start Node A B C D E 1 1 2 3 4 Finish Node 2 3 5 4 5 OPTIMISTIC to 28 18
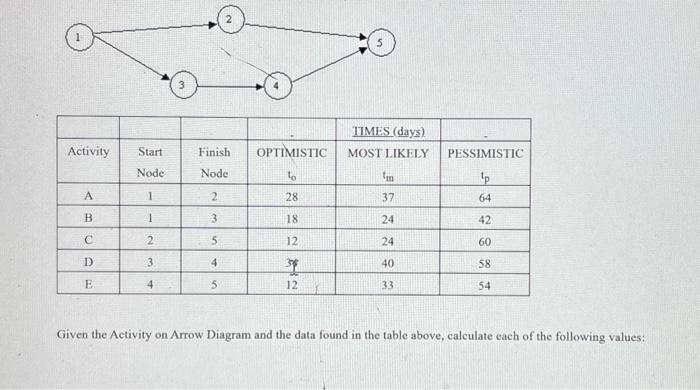
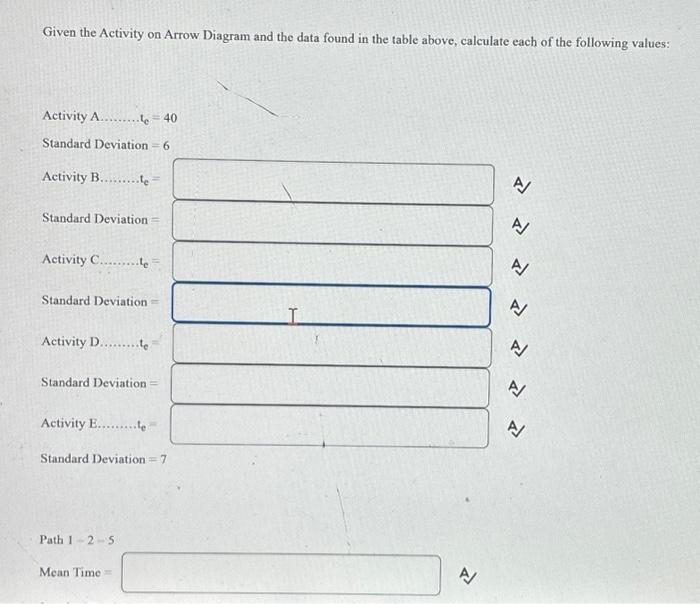
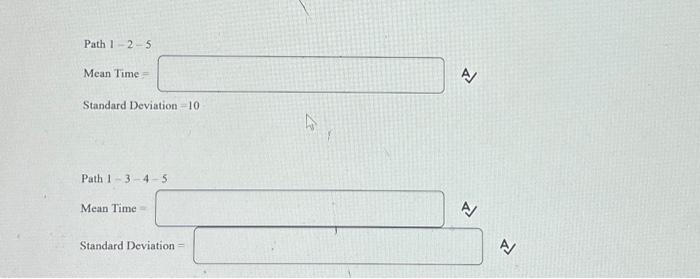
Activity Start Node A B C D E 1 1 2 3 4 Finish Node 2 3 5 4 5 OPTIMISTIC to 28 18 12 12 S TIMES (days) MOST LIKELY 'm 37 24 24 40 33 PESSIMISTIC p 64 42 60 58 54 Given the Activity on Arrow Diagram and the data found in the table above, calculate each of the following values: Given the Activity on Arrow Diagram and the data found in the table above, calculate each of the following values: Activity Ate=40 Standard Deviation=6 Activity B.........le= Standard Deviation : Activity C...te Standard Deviation= Activity D. ...te Standard Deviation Activity Ele Standard Deviation = 7 Path 1-2-5 Mean Time A N E N A Path 1-2-5 Mean Time= Standard Deviation 10 Path 1-3-4-5 Mean Time - Standard Deviation. 4 >> A A AV
Step by Step Solution
There are 3 Steps involved in it
The images provided show an Activity on Arrow AoA network diagram along with a table indicating the ... View full answer

Get step-by-step solutions from verified subject matter experts