

Question: Actually this is to be done in a spreadsheet like excel. Have to show what u did to get the information being asked for in
Actually this is to be done in a spreadsheet like excel. Have to show what u did to get the information being asked for in the spreadsheet
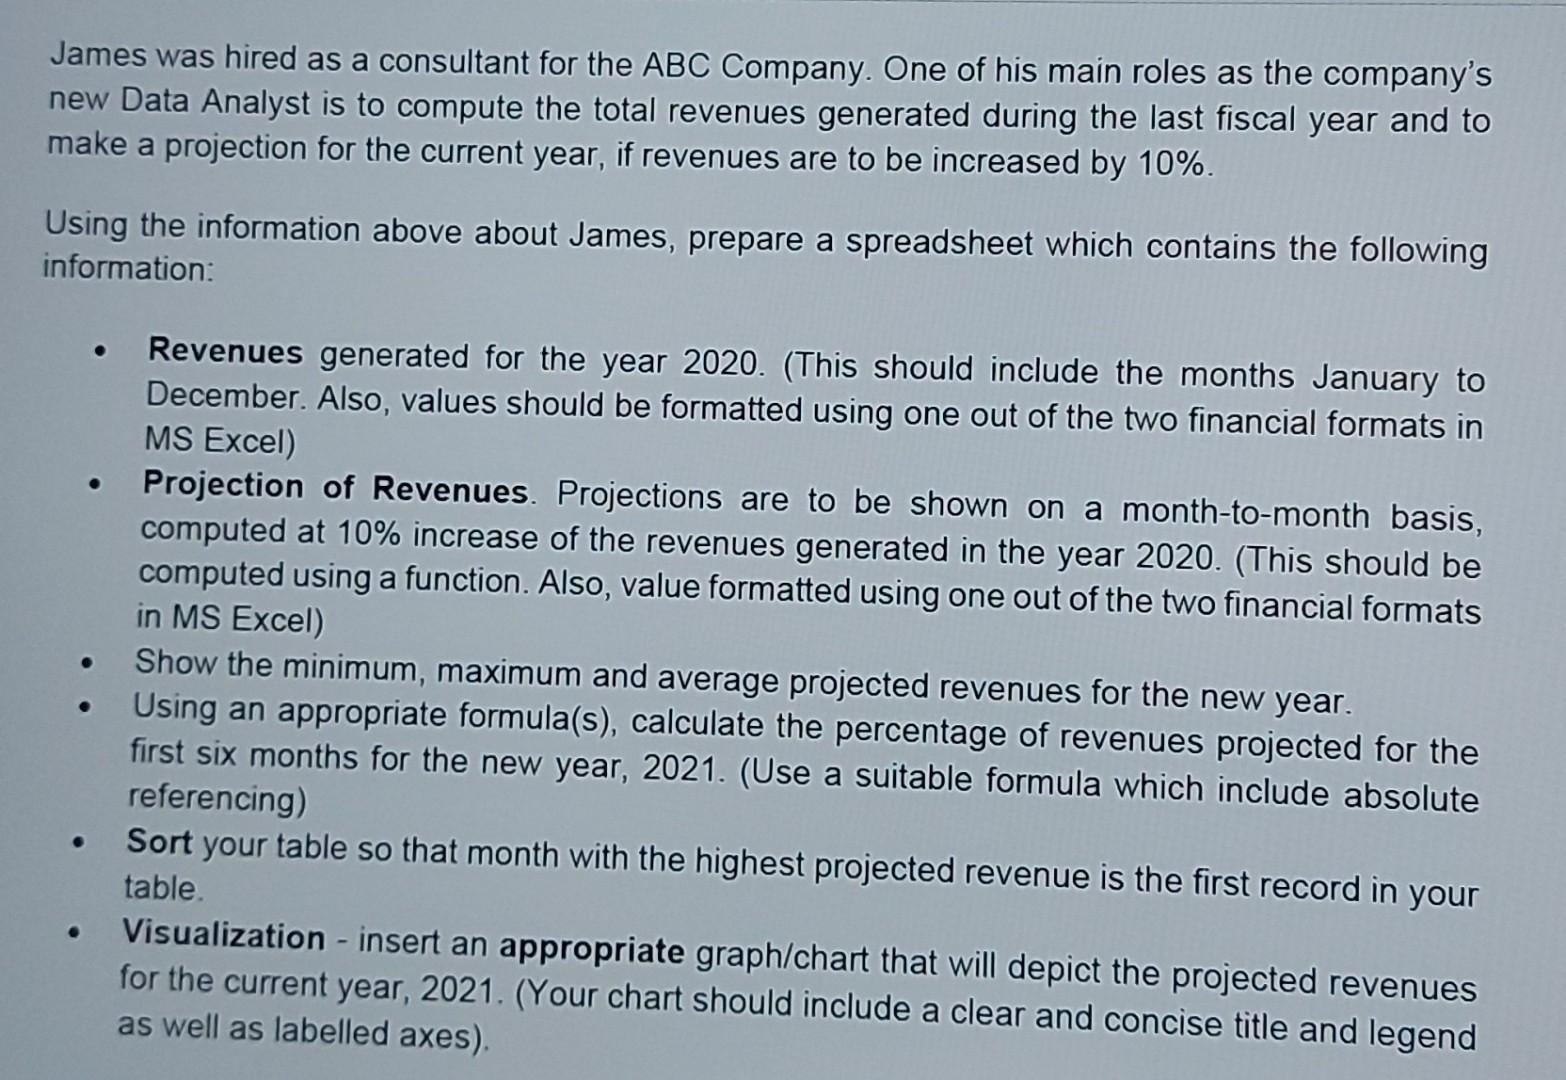
James was hired as a consultant for the ABC Company. One of his main roles as the company's new Data Analyst is to compute the total revenues generated during the last fiscal year and to make a projection for the current year, if revenues are to be increased by 10%. Using the information above about James, prepare a spreadsheet which contains the following information: Revenues generated for the year 2020. (This should include the months January to December. Also, values should be formatted using one out of the two financial formats in MS Excel) Projection of Revenues. Projections are to be shown on a month-to-month basis, computed at 10% increase of the revenues generated in the year 2020. (This should be computed using a function. Also, value formatted using one out of the two financial formats in MS Excel) Show the minimum, maximum and average projected revenues for the new year. Using an appropriate formula(s), calculate the percentage of revenues projected for the first six months for the new year, 2021. (Use a suitable formula which include absolute referencing) Sort your table so that month with the highest projected revenue is the first record in your table. Visualization - insert an appropriate graph/chart that will depict the projected revenues for the current year, 2021. (Your chart should include a clear and concise title and legend as well as labelled axes)
Step by Step Solution
There are 3 Steps involved in it

Get step-by-step solutions from verified subject matter experts