

Question: Actuarial Control Cycle Questions Background You work with the pricing actuary at Cash for Claims, a large Property/Casualty insurer. The CEO has some questions based
Actuarial Control Cycle Questions
Background
You work with the pricing actuary at Cash for Claims, a large Property/Casualty insurer. The CEO has some questions based on the most recent pricing analysis and the pricing actuary has asked you to assist with the response.
Your Tasks
Your answers to the questions are to be contained in the one Microsoft Word template document (either "EMA_template.doc" or "EMA_template.docx") that you downloaded when obtaining this document and the spreadsheet.
Task #1
The proposed rates were not in the range the CEO expected given the pricing analysis. The CEO has asked the pricing actuary to verify the total projected loss cost excluding potential large storm losses for 2020. In turn, the pricing actuary has asked you to independently calculate the projected costs.
All policies are 12-month policies. The rates will take effect July 1, 2020 and will be in effect for one year. In 2017 there was a large storm resulting in an additional 230 storm-related claims averaging 30,000 each. The company was able to settle 40% of all total claim liabilities relating to those claims within 2017 with the remainder being paid out in 2018. All other claims are completely settled by the end of year 4. The pricing actuary determined trend factors using the least squares method and determined the projected loss cost based on the loss costs for 2018 and 2019 with weightings of 40% and 60% respectively. You are to use the same methodology. The data and underlying model are in the Excel worksheet
Your response should be formatted as an internal memorandum to the pricing actuary and should include the projected loss costs for 2018 and 2019. Please show your work in an appendix.
Task #2
After agreeing that the previous pricing analysis was accurate, the CEO commented that the initially proposed rates per 1,000 have increased much higher than both the trend you had determined and the overall industry trend for losses. Discuss two to four factors that may be driving this. What possible actions could the insurer take to reduce rates for next year and beyond? What are the considerations that would need to be made with each of these actions?
Please format your response as an email to the CEO.
The relevant excel file:
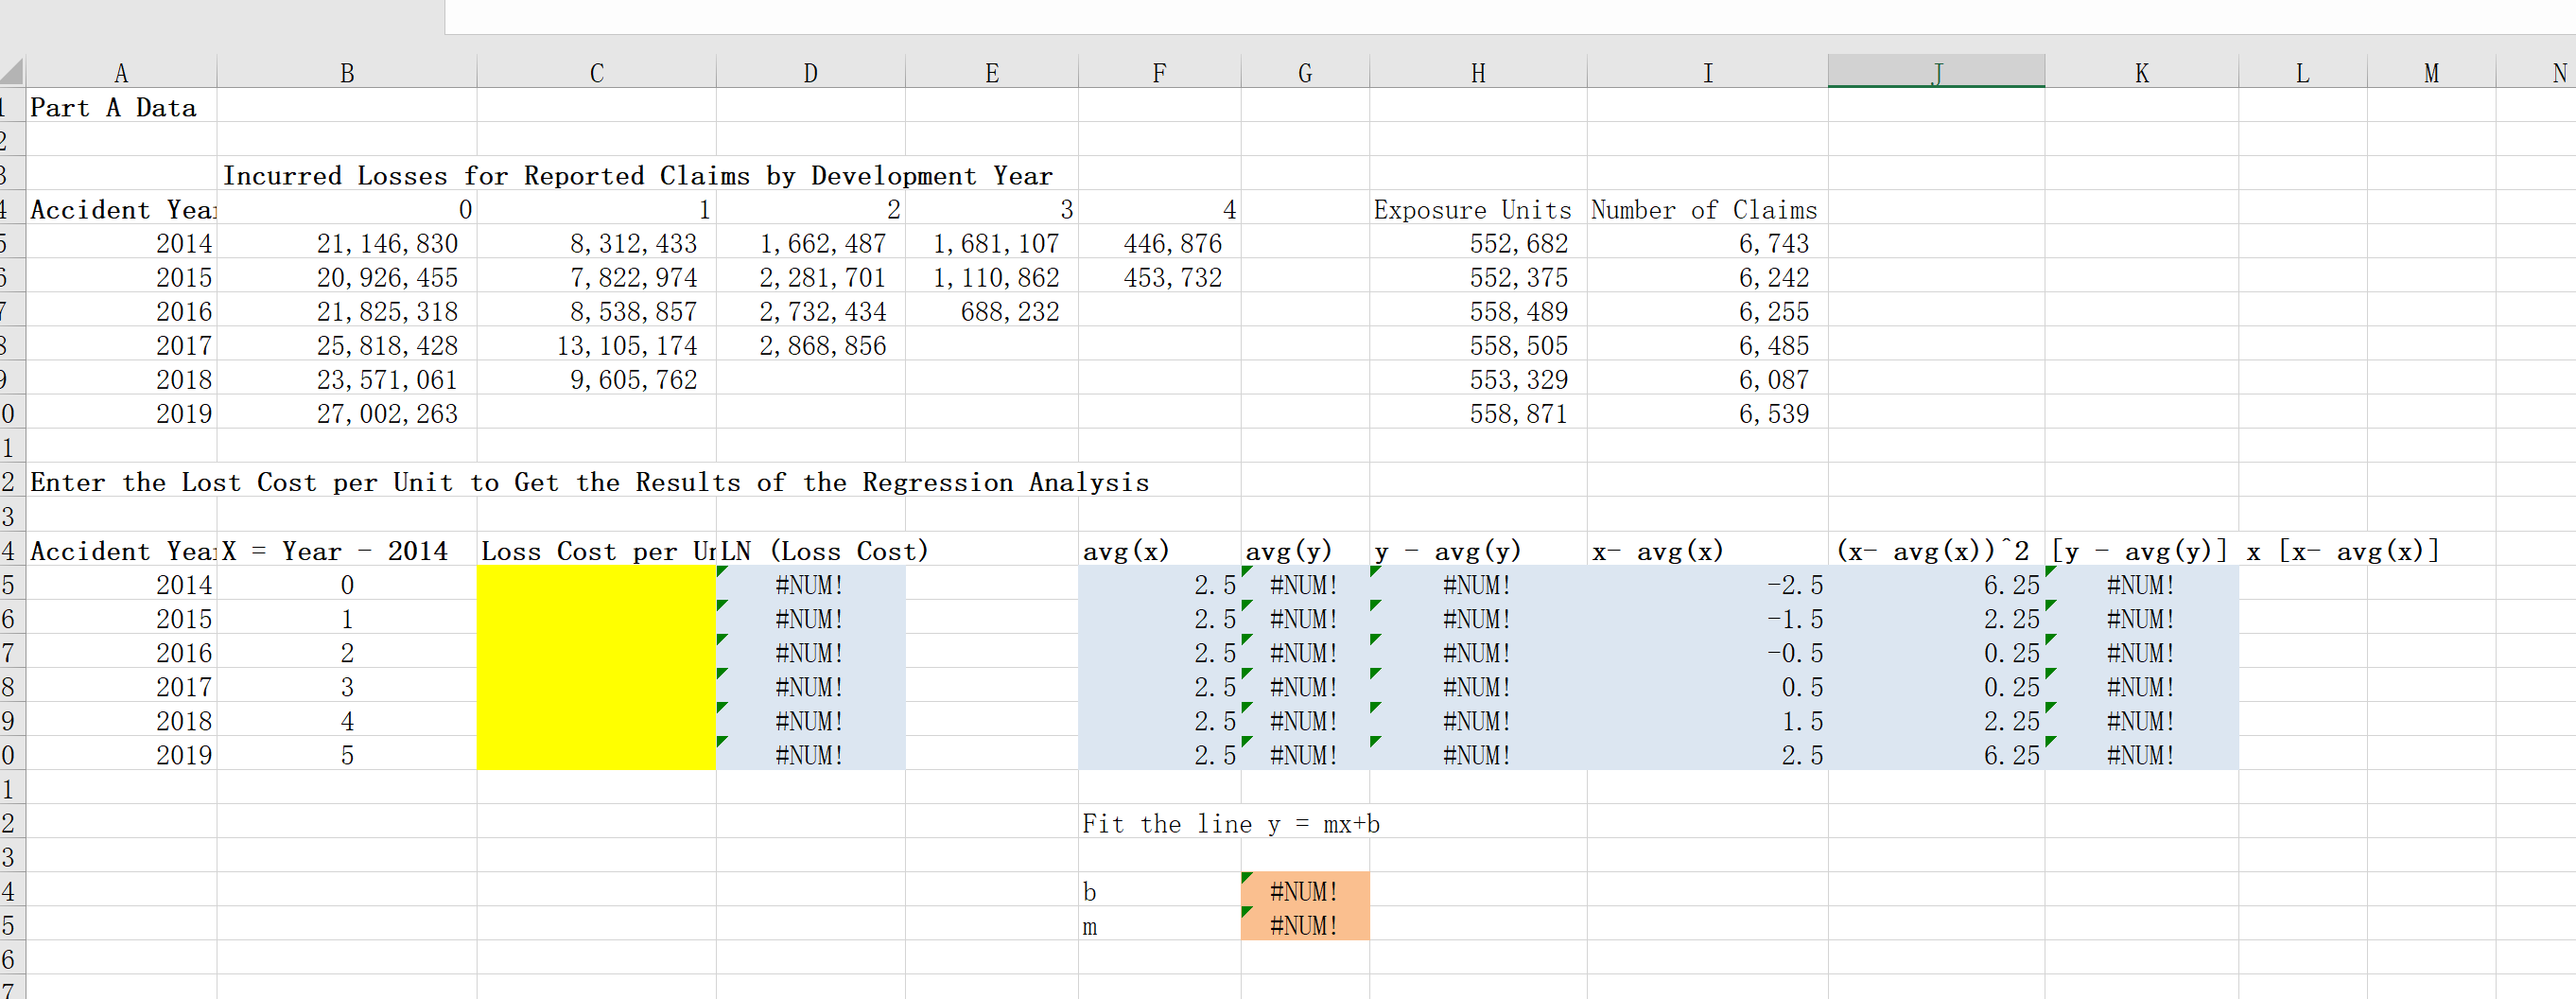
A B C D E F G H I K L M Part A Data Incurred Losses for Reported Claims by Development Year Accident Year 3 4 Exposure Units Number of Claims 2014 21, 146, 830 8, 312, 433 1, 662, 487 1, 681, 107 446, 876 552, 682 6, 743 2015 20, 926, 455 7, 822, 974 2, 281, 701 1, 110, 862 453, 732 552, 375 6, 242 2016 21, 825, 318 8, 538, 857 2, 732, 434 688, 232 558, 489 6, 255 2017 25, 818, 428 13, 105, 174 2, 868, 856 558, 505 6, 485 2018 23, 571, 061 9, 605, 762 553, 329 6, 087 2019 27, 002, 263 558, 871 6, 539 2 Enter the Lost Cost per Unit to Get the Results of the Regression Analysis Accident YeaX = Year - 2014 Loss Cost per UILN (Loss Cost) avg (x) avg (y) y avg (y) x- avg (x) (x- avg (x) ) "2 [y - avg (y) ] x [x- avg(x) ] 2014 #NUM 2. 5 #NUM! #NUM -2. 5 6. 25 #NUM! 2015 #NUM! 2. 5 #NUM! #NUM! -1. 5 2. 25 #NUM! 2016 #NUM! 2. 5 #NUM! #NUM! - 0.5 0. 25" #NUM! IWONH 2017 #NUM! 2. 5 #NUM! #NUM! 0.5 0. 25 #NUM! 2018 #NUM! 2. 5 #NUM! #NUM! 1 . 5 2. 25' #NUM! 2019 #NUM! 2. 5 #NUM! #NUM! 2. 5 6. 25 #NUM! Fit the line y = mx+b b #NUM! m #NUM
Step by Step Solution
There are 3 Steps involved in it

Get step-by-step solutions from verified subject matter experts