

Question: Add a new sheet for this question. Question #2) [ 20 pts] A manufacturer has determined that an employee with d days of production experience
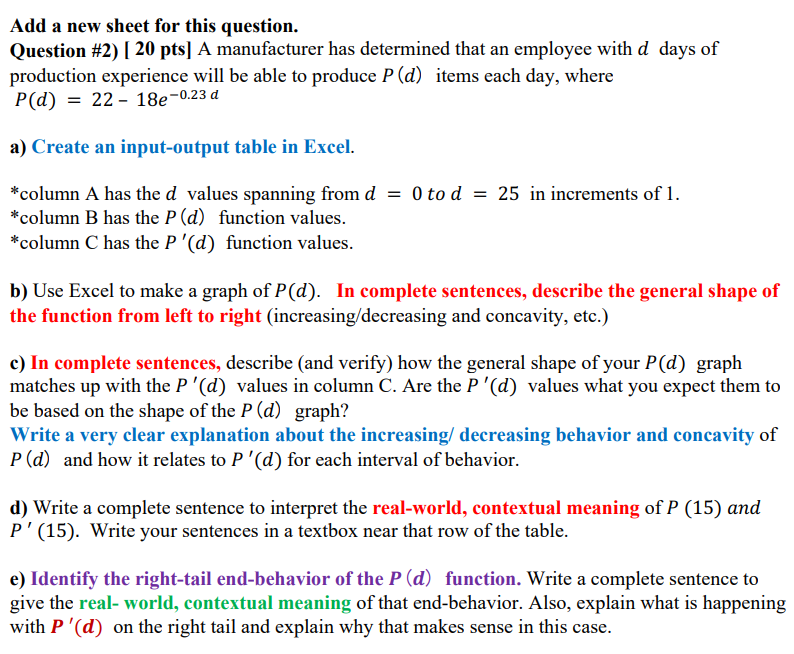
Add a new sheet for this question. Question \#2) [ 20 pts] A manufacturer has determined that an employee with d days of production experience will be able to produce P(d) items each day, where P(d)=2218e0.23d a) Create an input-output table in Excel. *column A has the d values spanning from d=0 to d=25 in increments of 1 . *column B has the P(d) function values. *column C has the P(d) function values. b) Use Excel to make a graph of P(d). In complete sentences, describe the general shape of the function from left to right (increasing/decreasing and concavity, etc.) c) In complete sentences, describe (and verify) how the general shape of your P(d) graph matches up with the P(d) values in column C. Are the P(d) values what you expect them to be based on the shape of the P(d) graph? Write a very clear explanation about the increasing/ decreasing behavior and concavity of P(d) and how it relates to P(d) for each interval of behavior. d) Write a complete sentence to interpret the real-world, contextual meaning of P (15) and P(15). Write your sentences in a textbox near that row of the table. e) Identify the right-tail end-behavior of the P(d) function. Write a complete sentence to give the real- world, contextual meaning of that end-behavior. Also, explain what is happening with P(d) on the right tail and explain why that makes sense in this case
Step by Step Solution
There are 3 Steps involved in it

Get step-by-step solutions from verified subject matter experts