Question: Add brief paragraph for discussion or future work/learning derived from the following queries # What is the average monthly stock price for a particular company
Add brief paragraph for discussion or future work/learning derived from the following queries
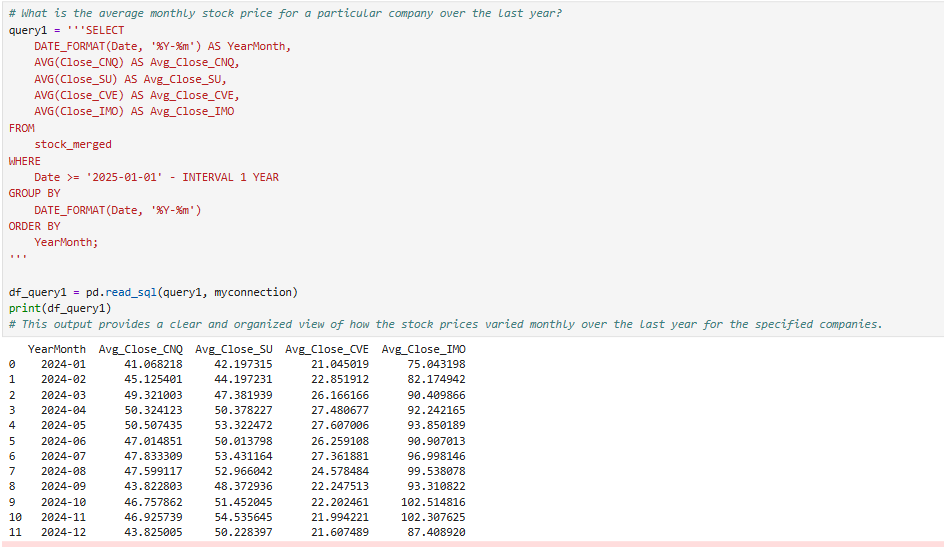
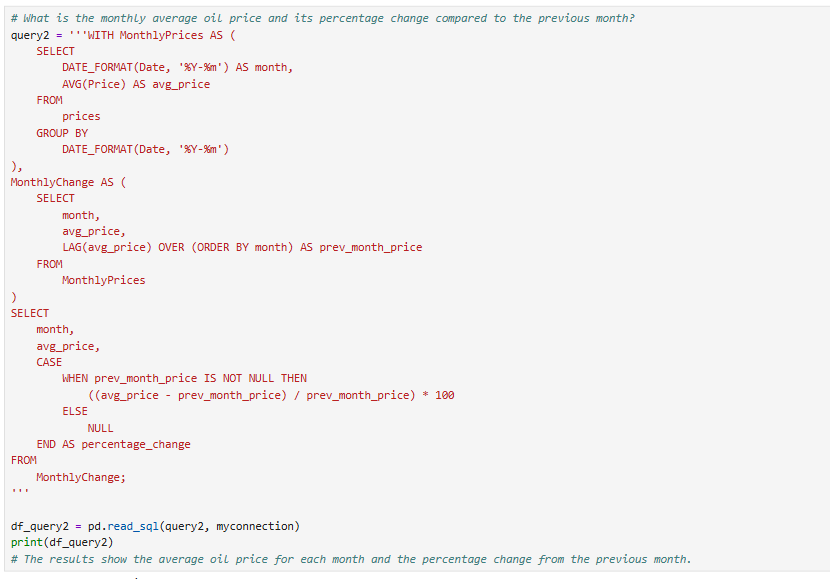
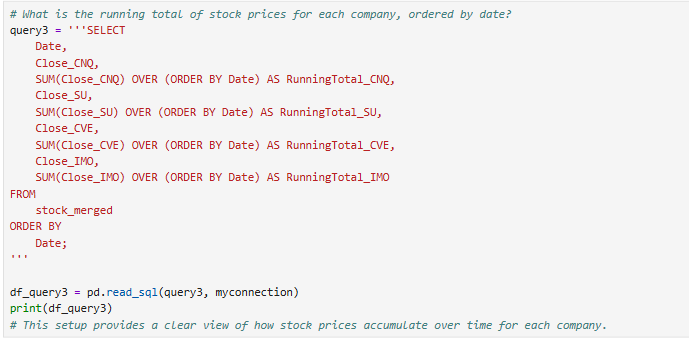
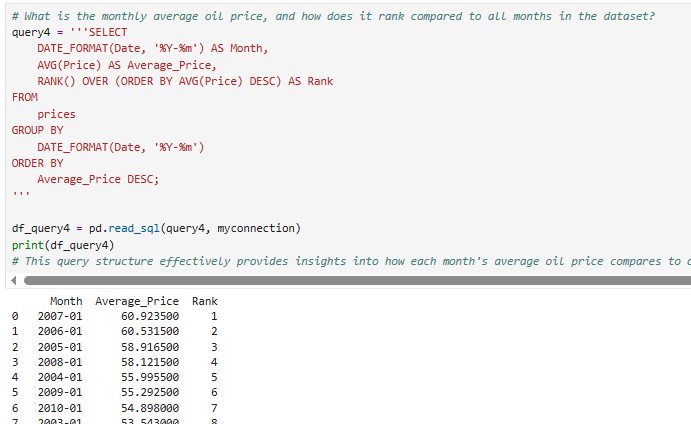
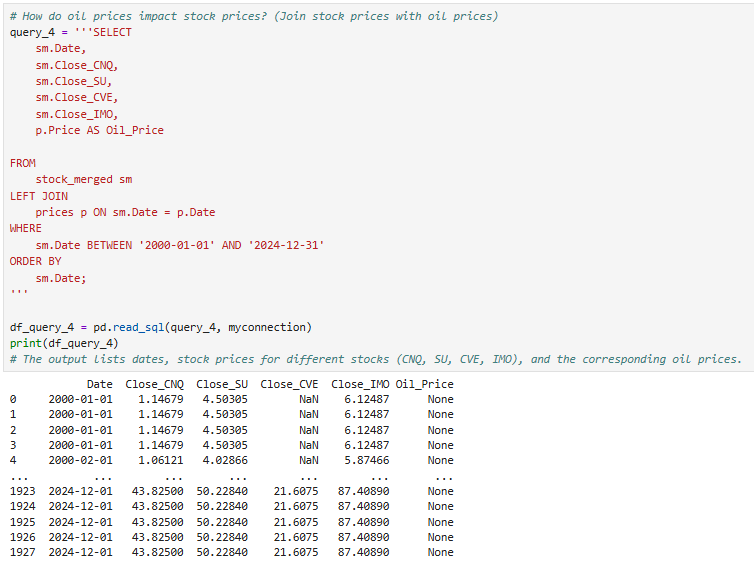
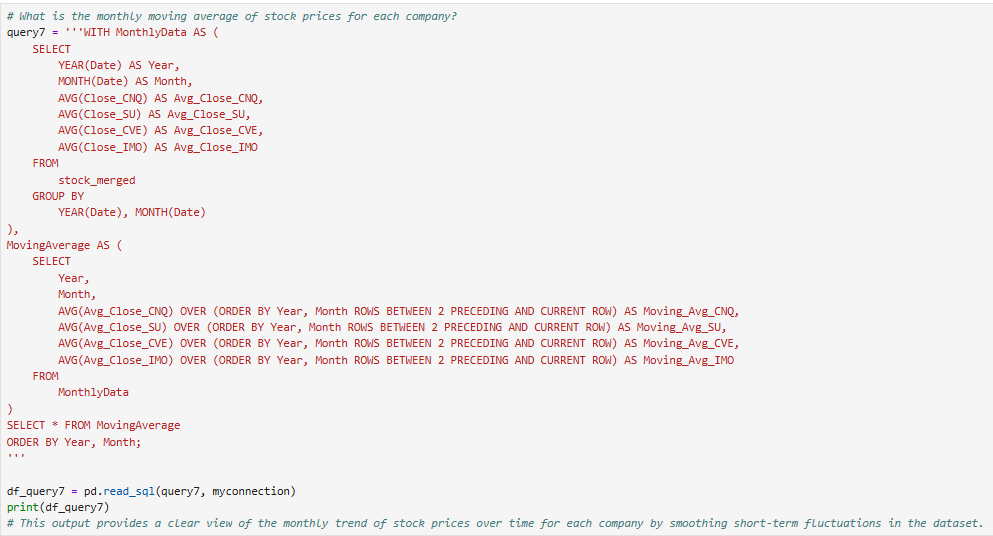
# What is the average monthly stock price for a particular company over the Last year? query1 = "SELECT DATE_FORMAT (Date, '*Y-*m' ) AS YearMonth, AVG(Close_CNQ) AS Avg_Close_CNQ, AVG(Close_SU) AS Avg_Close_SU, AVG(Close_CVE) AS Avg_Close_CVE, AVG(Close_IMO) AS Avg_Close_IMO FROM stock_merged WHERE Date >= '2025-01-01' - INTERVAL 1 YEAR GROUP BY DATE_FORMAT (Date, 'XY-*m" ) ORDER BY YearMonth; df_query1 = pd. read_sql(queryl, myconnection) print(df_query1) # This output provides a clear and organized view of how the stock prices varied monthly over the Last year for the specified companies. YearMonth Avg_Close_CNQ Avg_Close_SU Avg_Close_OVE Avg_Close_IMO 2024-01 41.068218 42.197315 21. 045019 75.043198 2024-02 45. 125401 44. 197231 22. 851912 82.174942 2024-03 49. 321093 47 . 381939 26.166166 90. 409866 2024-04 50. 324123 50.378227 27.480677 92. 242165 GUSWNA 2024-05 50.507435 53.322472 27.607006 93. 850189 2024-06 47.014851 50.013798 26. 259108 90.907013 2024-07 47.833309 53.431164 27 . 361881 96.998146 2024-08 47 . 599117 52.966042 24.578484 99.538078 2024-09 43.822803 48. 372936 22. 247513 93. 310822 2024-10 46.757862 51. 452045 22.202461 102 . 514816 10 2024-11 46.925739 54.535645 21. 994221 102.307625 11 2024-12 43. 825005 50.228397 21. 607489 87 . 408920# What is the monthly average oil price and its percentage change compored to the previous month? query? = "'"WITH MonthlyPrices AS SELECT DATE_FORMAT(Date, '%-Sm') AS month, AVG(Price) AS avg_price FROM prices GROUP BY DATE_FORMAT(Date, '%-%m') }s MonthlyChange AS { SELECT month, ave_price, LAG(ave_price) OVER (ORDER BY month) AS prev_month_price FROM MonthlyPrices ) SELECT month, ave_price, CASE WHEN prev_month_price IS NOT NULL THEN ((avg_price - prev_month_price) / prev_month_price) * lea ELSE AULL END AS percentage_change FROM MonthlyChange; df_query? = pd.read_sql(query2, myconmection) print(df_query2) # The results show the average oil price for each month and the percentage change from the previous month. # What is the running total of stock prices for each company, ordered by date? query3 = ""SELECT Date, Close_CNQ, SUM(Close_CNQ) OVER (ORDER BY Date) AS RunningTotal_CNQ, Close_SU, SUM(Close_SU) OVER (ORDER BY Date) AS RunningTotal_SU, Close CVE, SUM(Close_CVE) OVER (ORDER BY Date) AS RunningTotal_CVE, Close_IMO, SUM(Close_IMO) OVER (ORDER BY Date) AS RunningTotal_IMO FROM stock merged ORDER BY Date; df_query3 = pd. read_sql(query3, myconnection) print (df_query3) # This setup provides a clear view of how stock prices accumulate over time for each company.# What is the monthly average oil price, and how does it rank compared to all months in the dataset? query4 = ""SELECT DATE_FORMAT (Date, 'XY-Xm' ) AS Month, AVG(Price) AS Average_Price, RANK() OVER (ORDER BY AVG(Price) DESC) AS Rank FROM prices GROUP BY DATE_FORMAT (Date, 'XXY-Xm' ) ORDER BY Average_Price DESC; df_query4 = pd. read_sql(query4, myconnection) print (df_query4) # This query structure effectively provides insights into how each month's average oil price compares to Month Average_Price Rank 2007-01 60.923500 2006-01 60.531509 INP 2005-01 58.916500 3 2008-01 58.121500 2004-01 55.995500 5 2009-01 55. 292500 6 2010-01 54.898090# How do oil prices impact stock prices? (Join stock prices with oil prices) query_4 = ""SELECT 5m . Date, sm. Close_CNQ, sm . Close_SU, sm. Close_CVE, sm. Close_IMO, p. Price AS Oil_Price FROM stock_merged sm LEFT JOIN prices p ON sm. Date = p. Date WHERE sm. Date BETWEEN ' 2000-01-01' AND '2024-12-31' ORDER BY 5m . Date; df_query_4 = pd. read_sql(query_4, myconnection) print (df_query_4) # The output Lists dates, stock prices for different stocks (CNQ, SU, CVE, IMO), and the corresponding oil prices. Date Close_CNQ Close_SU Close_CVE Close_IMO Oil_Price 2090-01-01 1. 14679 4.50305 NaN 6.12487 None 2090-01-01 1.14679 4.50305 NaN 6.12487 None 2000-01-01 1.14679 4.50305 NaN 6.12487 None 2000-01-01 1.14679 4.50305 NaN 6.12487 None 2000-02-01 1. 06121 4.02866 NaN 5.87466 None 1923 2024-12-01 43. 82590 50.22840 21.6075 87.40890 None 1924 2024-12-01 43.82500 50.22840 21. 6075 87.40890 None 1925 2024-12-01 43. 82500 50.22840 21. 6075 87.40890 None 1926 2024-12-01 43. 82500 50.22840 21.6075 87. 40890 None 1927 2024-12-01 43. 82500 50.22840 21. 6075 87.40890 None# What is the monthly moving average of stock prices for each company? query7 = " WITH MonthlyData A5 ( SELECT YEAR(Date) AS Year, MONTH(Date) A5 Month, AVG (Close_CNQ) AS Avg_Close_CNQ, AVG(Close_SU) AS Avg_Close_SU, AVG(Close_CVE) AS Avg_Close_CVE, AVG(Close_IMO) AS Avg_Close_IMO FROM stock_merged GROUP BY YEAR(Date) , MONTH(Date) ) , MovingAverage AS ( SELECT Year, Month, AVG(Avg_Close_CNQ) OVER (ORDER BY Year, Month ROWS BETWEEN 2 PRECEDING AND CURRENT ROW) AS Moving_Avg_CNQ, AVG(Avg_Close_SU) OVER (ORDER BY Year, Month ROWS BETWEEN 2 PRECEDING AND CURRENT ROW) AS Moving_Avg_SU, AVG(Avg_Close_CVE) OVER (ORDER BY Year, Month ROWS BETWEEN 2 PRECEDING AND CURRENT ROW) AS Moving_Avg_CVE, AVG(Avg_Close_IMO) OVER (ORDER BY Year, Month ROWS BETWEEN 2 PRECEDING AND CURRENT ROW) AS Moving_Avg_IMO FROM MonthlyData SELECT * FROM MovingAverage ORDER BY Year, Month; df_query7 = pd. read_sql(query7, myconnection) print(df_query7) # This output provides a clear view of the monthly trend of stock prices over time for each company by smoothing short-term fluctuations in the dataset
Step by Step Solution
There are 3 Steps involved in it
1 Expert Approved Answer
Step: 1 Unlock
Question Has Been Solved by an Expert!
Get step-by-step solutions from verified subject matter experts
Step: 2 Unlock
Step: 3 Unlock
Students Have Also Explored These Related Finance Questions!