

Question: Adding on to what is shown in the picture, can you help me with solving for the test statistic, as well as what the range
Adding on to what is shown in the picture, can you help me with solving for the test statistic, as well as what the range of p-values are of the test? Based on the results do the colors follow the same distribution as stated in the problem?
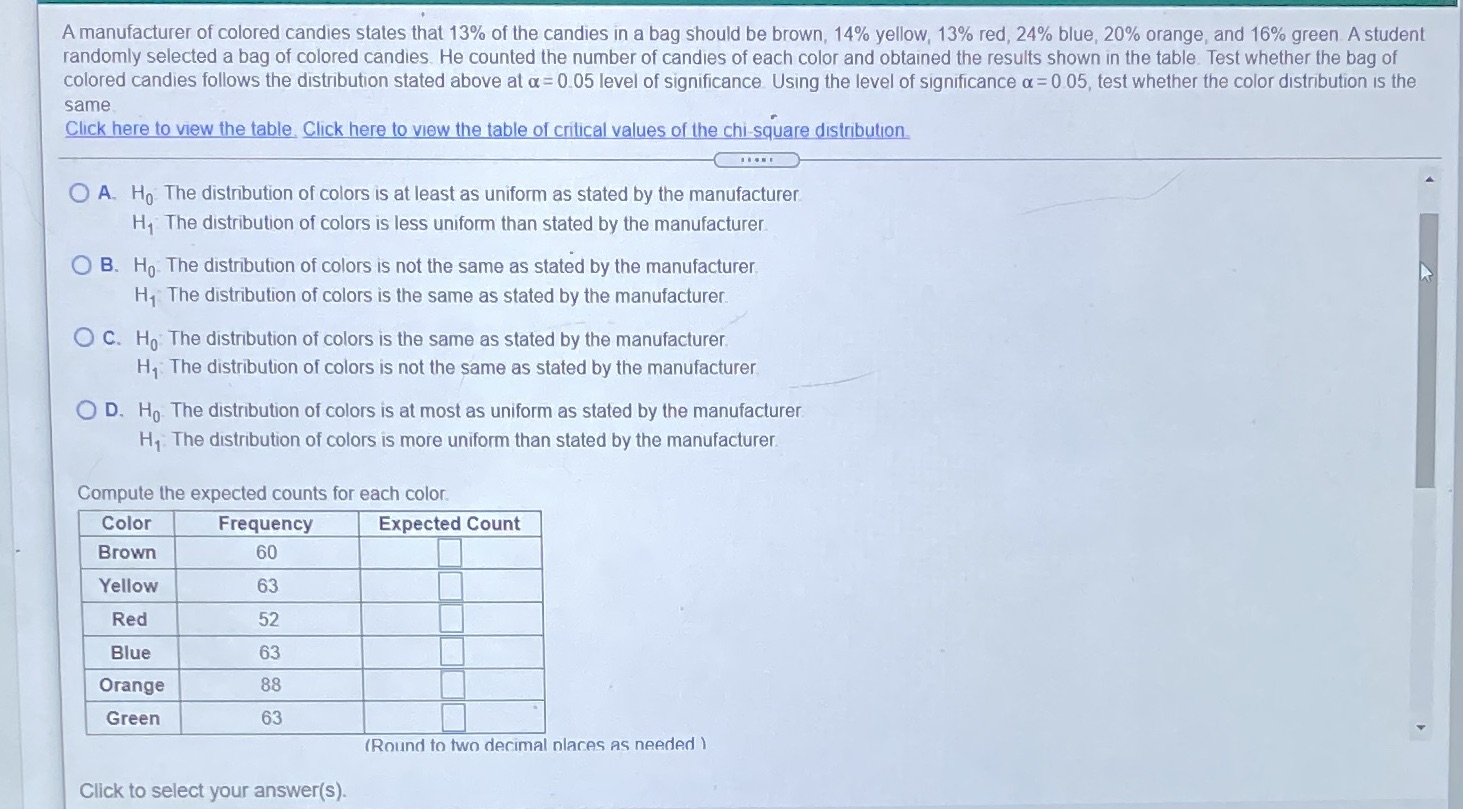
A manufacturer of colored candies states that 13% of the candies in a bag should be brown, 14% yellow, 13% red, 24% blue, 20% orange, and 16% green A student randomly selected a bag of colored candies. He counted the number of candies of each color and obtained the results shown in the table. Test whether the bag of colored candies follows the distribution stated above at a = 0.05 level of significance Using the level of significance a = 0.05, test whether the color distribution is the same Click here to view the table, Click here to view the table of critical values of the chi-square distribution. O A. Ho The distribution of colors is at least as uniform as stated by the manufacturer H, The distribution of colors is less uniform than stated by the manufacturer O B. Ho The distribution of colors is not the same as stated by the manufacturer. Hy The distribution of colors is the same as stated by the manufacturer. O C. Ho The distribution of colors is the same as stated by the manufacturer. H, The distribution of colors is not the same as stated by the manufacturer O D. Ho The distribution of colors is at most as uniform as stated by the manufacturer H1: The distribution of colors is more uniform than stated by the manufacturer. Compute the expected counts for each color. Color Frequency Expected Count Brown 60 Yellow 63 Red 52 Blue 63 Orange 88 Green 63 (Round to two decimal places as needed ) Click to select your answer(s)
Step by Step Solution
There are 3 Steps involved in it

Get step-by-step solutions from verified subject matter experts