Question: Additional Activities Get the samples needed for each category using stratified random sampling. There are 20 members of taekwondo club, 40 math club members, 60
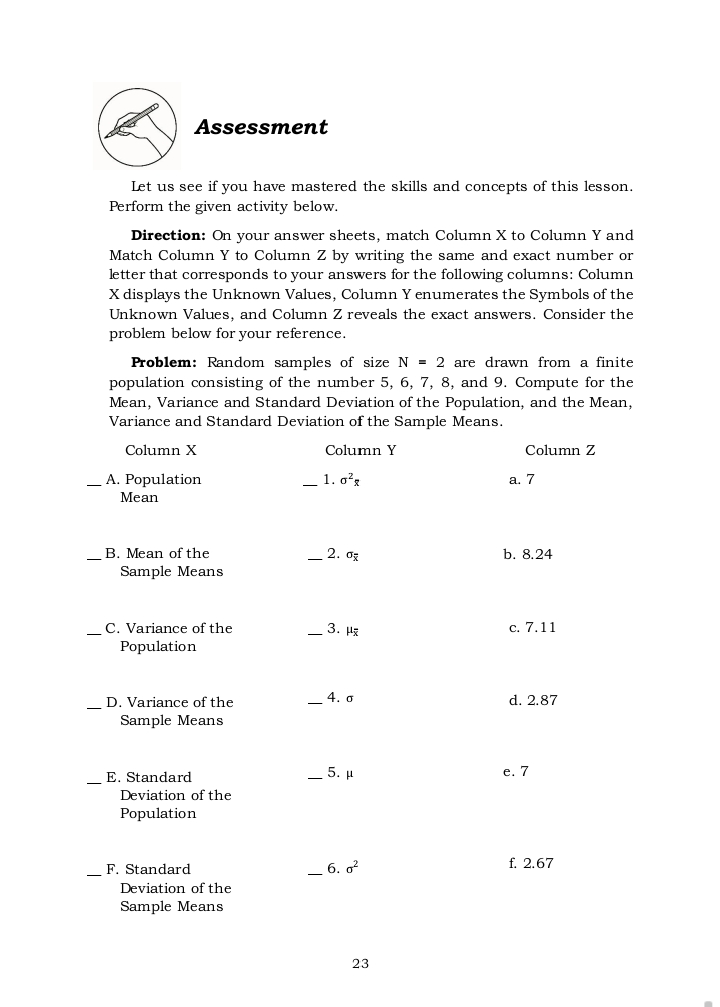
Additional Activities Get the samples needed for each category using stratified random sampling. There are 20 members of taekwondo club, 40 math club members, 60 drama theatre members, and 30 members of science club. The researchers want to get 20 respondents out of these organizations. Identify the samples to be taken in each organization.@ Assessment Decide whether the statement describes a parameter or statistic. Write your answer on a separate sheet of paper. 1. The average income of 3-H) out of 100 households in a certain Barangagrr is P 12, 2 13.00 a month. 2. Percentage of red cars in the Philippines. 3. Number of senior high schools in Region 3. 4. A recent surveyr of a sample of 25C! high school students reported the average weight of 54. 3 kg. 5. Average age of students in East High School. ID What's More A population consists of the numbers 2, 4, 8, 10 and 5. Let us list all the possible samples of size 3 from this population and construct the sampling distribution of the sample mean.Assessment Let us see if you have mastered the skills and concepts of this lesson. Perform the given activity below. Direction: On your answer sheets, match Column X to Column Y and Match Column Y to Column Z by writing the same and exact number or letter that corresponds to your answers for the following columns: Column X displays the Unknown Values, Column Y enumerates the Symbols of the Unknown Values, and Column Z reveals the exact answers. Consider the problem below for your reference. Problem: Random samples of size N = 2 are drawn from a finite population consisting of the number 5, 6, 7, 8, and 9. Compute for the Mean, Variance and Standard Deviation of the Population, and the Mean, Variance and Standard Deviation of the Sample Means. Column X Column Y Column Z A. Population _ 1. 0's a. 7 Mean B. Mean of the 2. OF b. 8.24 Sample Means C. Variance of the 3. HE c. 7.11 Population D. Variance of the 4. 0 d. 2.87 Sample Means E. Standard 5. H e. 7 Deviation of the Population F. Standard - 6. 02 f. 2.67 Deviation of the Sample Means 23
Step by Step Solution
There are 3 Steps involved in it
1 Expert Approved Answer
Step: 1 Unlock
Question Has Been Solved by an Expert!
Get step-by-step solutions from verified subject matter experts
Step: 2 Unlock
Step: 3 Unlock
Students Have Also Explored These Related Mathematics Questions!