

Question: additional info! The 2013 Intel Form 10-K can be found by clicking on this link: Intel 2013 10-K (a) Using the consolidated statements of operations,
 additional info!
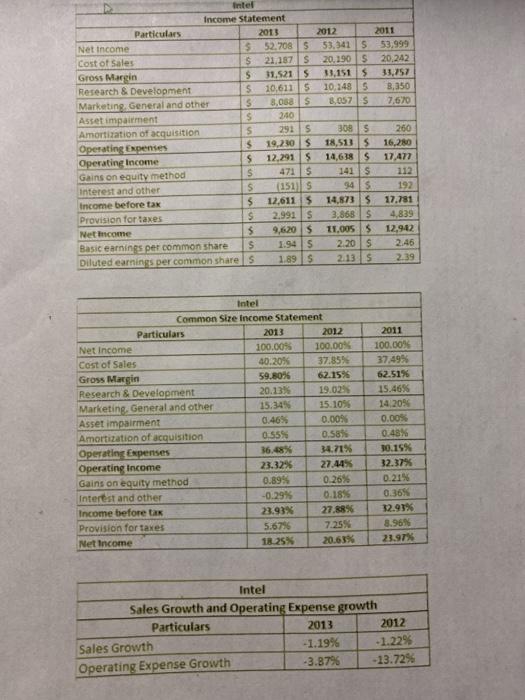
 The 2013 Intel Form 10-K can be found by clicking on this link: Intel 2013 10-K (a) Using the consolidated statements of operations, analyze the profitability of Intel by preparing a common-size income statement for the past three years (Don't post the common-size statements, just do it to help analyze the statement). In addition, calculate sales growth and operating expense growth for each two- year period presented, as well as effective tax rates for all three years. Discuss the profitability of Intel using this information and the Management Discussion and Analysis in the Form 10-K. (b) Using the consolidated statements of stockholders' equity for Intel, explain the key reasons for the changes in common stock, accumulated other comprehensive income, and retained earnings accounts. Evaluate these changes. 2011 2012 53.341 $ 53,999 20.190$ 20.242 33,1515 10.1485 3,350 3,057 s 7.670 Income statement Particulars 2015 Net Income $ 52.7085 Cost of Sales $ 21.1875 Gross Margin 31.5215 Research & Development 10,6115 Marketing General and other 8,058S Asset impairment 240 Amortization of acquisition 291 S Operating Expenses 19.230S Operating Income 12,2915 Gains on equity method 471 S Interest and other (151) Income before tak 12,611 Provision for taxes $ 2,991 s Net income $ 9.6.20$ Basic earnings per common share $ 1.945 Diluted earnings per common shares 1.89S wuuuu 3085 18,5135 14,638$ 141s 94 14.6735 3,868 $ 11.0055 2.20 $ 2.13 S 260 16,280 17,477 112 192 17.781 4,839 12,942 2.46 2.39 Intel Common Size Income Statement Particulars 2013 2012 Net Income 100.00% 100.00% Cost of Sales 40.20% 37.85% Gross Margin 59.8056 62.15% Research & Development 20.13% 19.029 Marketing. General and other 15.34% 15.10% Asset impairment 0.46% 0.00% Amortization acquisition 0.555 0.58% Operating Expenses 36.68% 34.71% Operating Income 23.32% 27.44% Gains on equity method 0.895 0.26% Interest and other -0.29% 0.18% Income before tak 23.93% 27.88% Provision for taxes 5.6796 7.25% Net Income 18.25% 20.63% 2011 100.00% 37,495 62.51% 15.46% 14.205 0.00% 0.48% 30.15% 32.37% 0.21% 0.365 32.93% 8.96 23.97% Intel Sales Growth and Operating Expense growth Particulars 2013 2012 Sales Growth -1.19% -1.22% Operating Expense Growth -3.87% -13.72% The 2013 Intel Form 10-K can be found by clicking on this link: Intel 2013 10-K (a) Using the consolidated statements of operations, analyze the profitability of Intel by preparing a common-size income statement for the past three years (Don't post the common-size statements, just do it to help analyze the statement). In addition, calculate sales growth and operating expense growth for each two- year period presented, as well as effective tax rates for all three years. Discuss the profitability of Intel using this information and the Management Discussion and Analysis in the Form 10-K. (b) Using the consolidated statements of stockholders' equity for Intel, explain the key reasons for the changes in common stock, accumulated other comprehensive income, and retained earnings accounts. Evaluate these changes. 2011 2012 53.341 $ 53,999 20.190$ 20.242 33,1515 10.1485 3,350 3,057 s 7.670 Income statement Particulars 2015 Net Income $ 52.7085 Cost of Sales $ 21.1875 Gross Margin 31.5215 Research & Development 10,6115 Marketing General and other 8,058S Asset impairment 240 Amortization of acquisition 291 S Operating Expenses 19.230S Operating Income 12,2915 Gains on equity method 471 S Interest and other (151) Income before tak 12,611 Provision for taxes $ 2,991 s Net income $ 9.6.20$ Basic earnings per common share $ 1.945 Diluted earnings per common shares 1.89S wuuuu 3085 18,5135 14,638$ 141s 94 14.6735 3,868 $ 11.0055 2.20 $ 2.13 S 260 16,280 17,477 112 192 17.781 4,839 12,942 2.46 2.39 Intel Common Size Income Statement Particulars 2013 2012 Net Income 100.00% 100.00% Cost of Sales 40.20% 37.85% Gross Margin 59.8056 62.15% Research & Development 20.13% 19.029 Marketing. General and other 15.34% 15.10% Asset impairment 0.46% 0.00% Amortization acquisition 0.555 0.58% Operating Expenses 36.68% 34.71% Operating Income 23.32% 27.44% Gains on equity method 0.895 0.26% Interest and other -0.29% 0.18% Income before tak 23.93% 27.88% Provision for taxes 5.6796 7.25% Net Income 18.25% 20.63% 2011 100.00% 37,495 62.51% 15.46% 14.205 0.00% 0.48% 30.15% 32.37% 0.21% 0.365 32.93% 8.96 23.97% Intel Sales Growth and Operating Expense growth Particulars 2013 2012 Sales Growth -1.19% -1.22% Operating Expense Growth -3.87% -13.72%
Step by Step Solution
There are 3 Steps involved in it

Get step-by-step solutions from verified subject matter experts