

Question: Additional question not pictured: since the critical value for n=6 is 0.888, we can conclude that the shape of the distribution is ____. The data
Additional question not pictured: since the critical value for n=6 is 0.888, we can conclude that the shape of the distribution is ____.
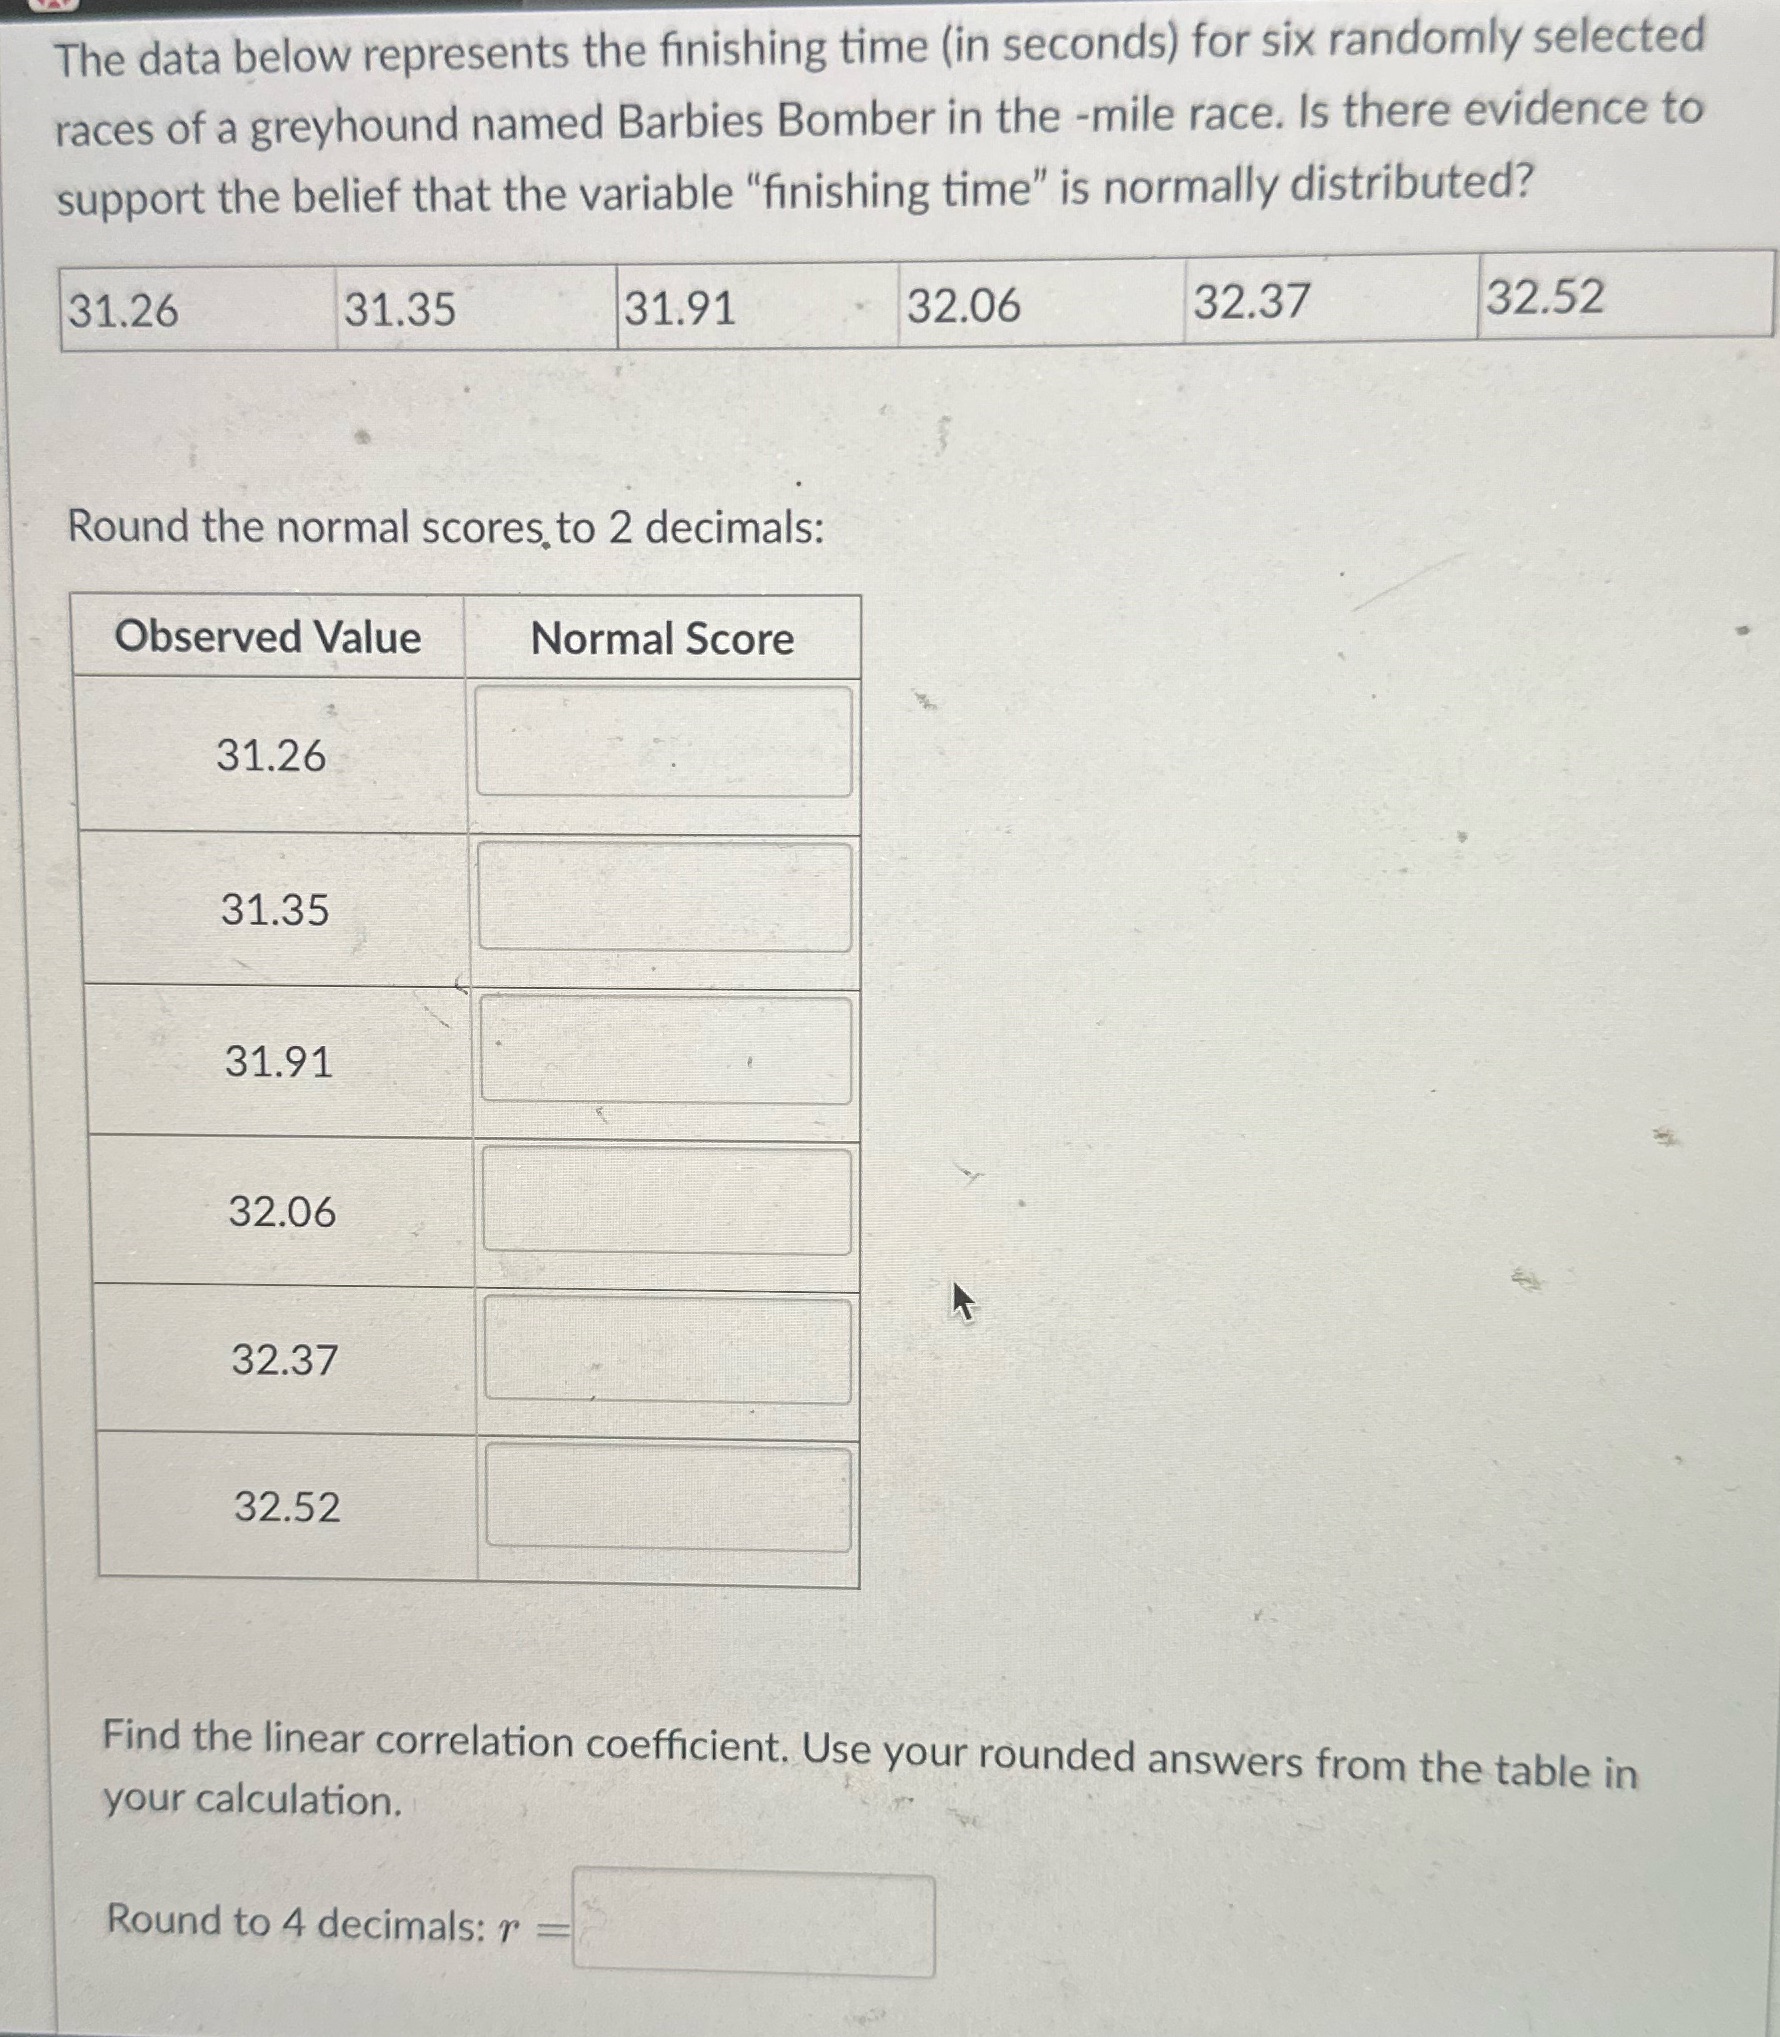
The data below represents the finishing time (in seconds) for six randomly selected races of a greyhound named Barbies Bomber in the -mile race. Is there evidence to support the belief that the variable "finishing time" is normally distributed? 31.26 31.35 31.91 32.06 32.37 32.52 Round the normal scores, to 2 decimals: Observed Value Normal Score 31.26 31.35 31.91 32.06 32.37 32.52 Find the linear correlation coefficient. Use your rounded answers from the table in your calculation. Round to 4 decimals: r
Step by Step Solution
There are 3 Steps involved in it

Get step-by-step solutions from verified subject matter experts