

Question: Address whether commute time is approximately normally distributed or not. Point to information in your analysis that proves your point. Also write a brief descriptive
Address whether commute time is approximately normally distributed or not. Point to information in your analysis that proves your point. Also write a brief descriptive paragraph about the data. Cover the units of observation, the sample size, the shape of the data, measures of central tendency, and measures of variability.
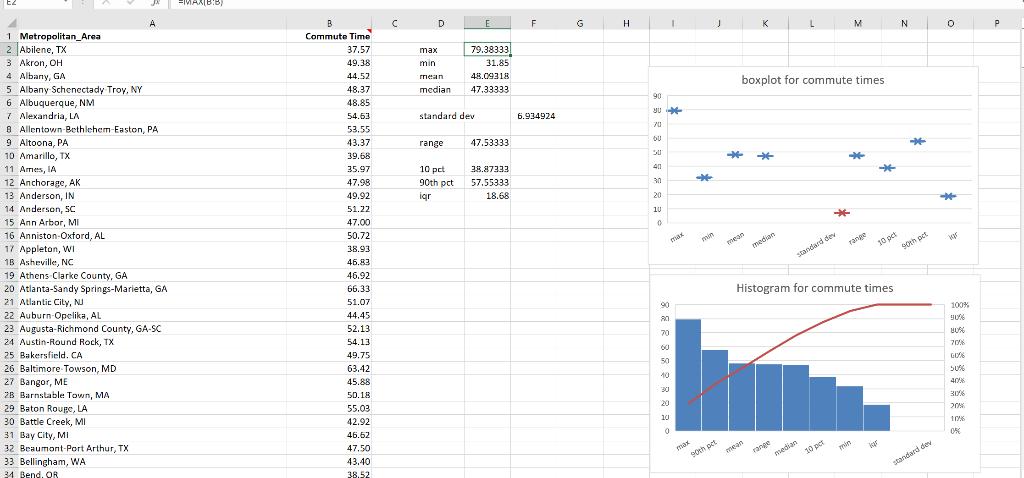
Ez 1 Metropolitan Area 2 Abilene, TX 3 Akron, OH 4 Albany, GA 5 Albany Schenectady Troy, NY 6 Albuquerque, NM 7 Alexandria, LA 8 Allentown-Bethlehem-Easton, PA 9 Altoona, PA 10 Amarillo, TX 11 Ames, IA 12 Anchorage, AK 13 Anderson, IN 14 Anderson, SC 15 Ann Arbor, MI 16 Anniston-Oxford, AL 17 Appleton, WI 18 Asheville, NC 19 Athens Clarke County, GA 20 Atlanta-Sandy Springs-Marietta, GA 21 Atlantic City, Nu 22 Auburn-Opelika, AL 23 Augusta-Richmond County, GA-SC 24 Austin-Round Rock, TX 25 Bakersfield. CA 26 Baltimore-Towson, MD 27 Bangor, ME 28 Barnstable Town, MA. 29 Baton Rouge, LA 30 Battle Creek, MI 31 Bay City, MI 32 Beaumont-Port Arthur, TX 33 Bellingham, WA 34 Bend, OR =MAX(B:B) B Commute Time 37.57 49.38 44.52 48.37 48.85 54.63 53.55 43.37 39.68 35.97 47.98 49.92 51.22 47.00 50.72 38.93 46.83 46.92 66.33 51.07 44.45 52.13 54.13 49.75 63.42 45.88 50.18 55.03 42.92 46.62 47.50 43.40 38.52 C D max min mean median standard dev range 10 pct 90th pct igr E 79.38333 31.85 48.09318 47.33333 47.53333 38.87333 57.55333 18.68 F 6.934924 G H 90 JU 70 60 401 30 20 10 0 90 80 70 8888888: 60 50 40 1 20 max 0 max * J * 90th pct min mean K boxplot for commute times mean * median L range standard dev median * M 10 pct * Histogram for commute times range min -** Val 10 pct N * 90th pet 0 standard dev * 100% 90% 80% 70% 00% 50% 40% 30% 20% 10% 0% P
Step by Step Solution
3.46 Rating (166 Votes )
There are 3 Steps involved in it

Get step-by-step solutions from verified subject matter experts