

Using ratios to conduct financial analysis must be done with care. One year's worth of data is
Question:
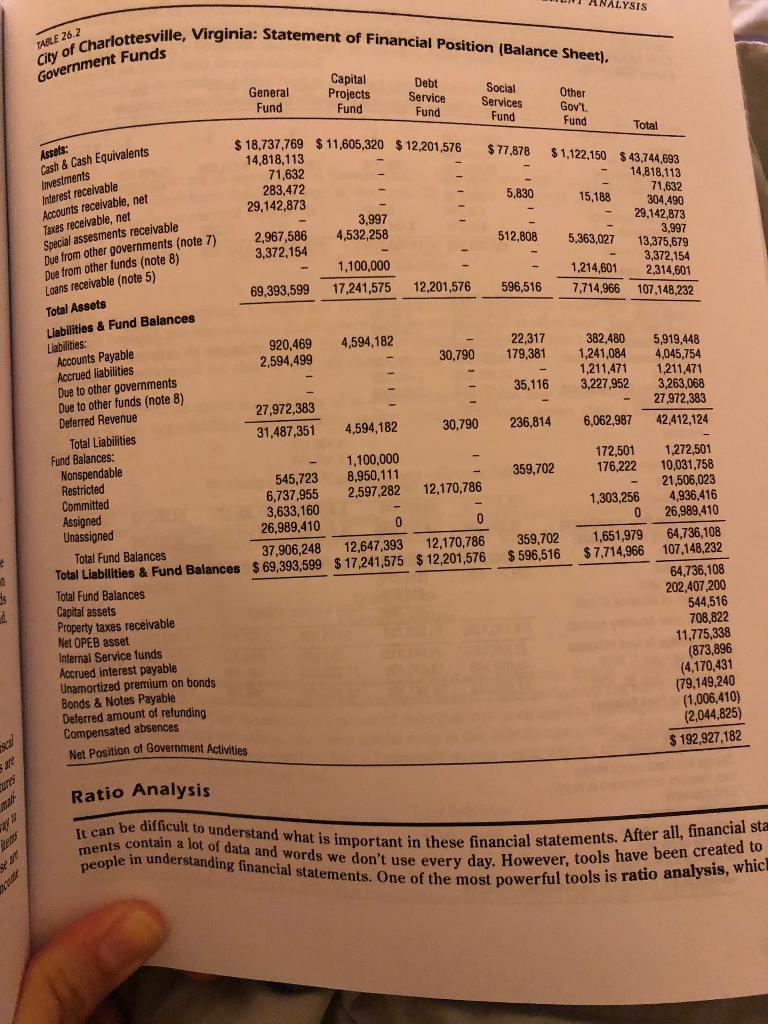
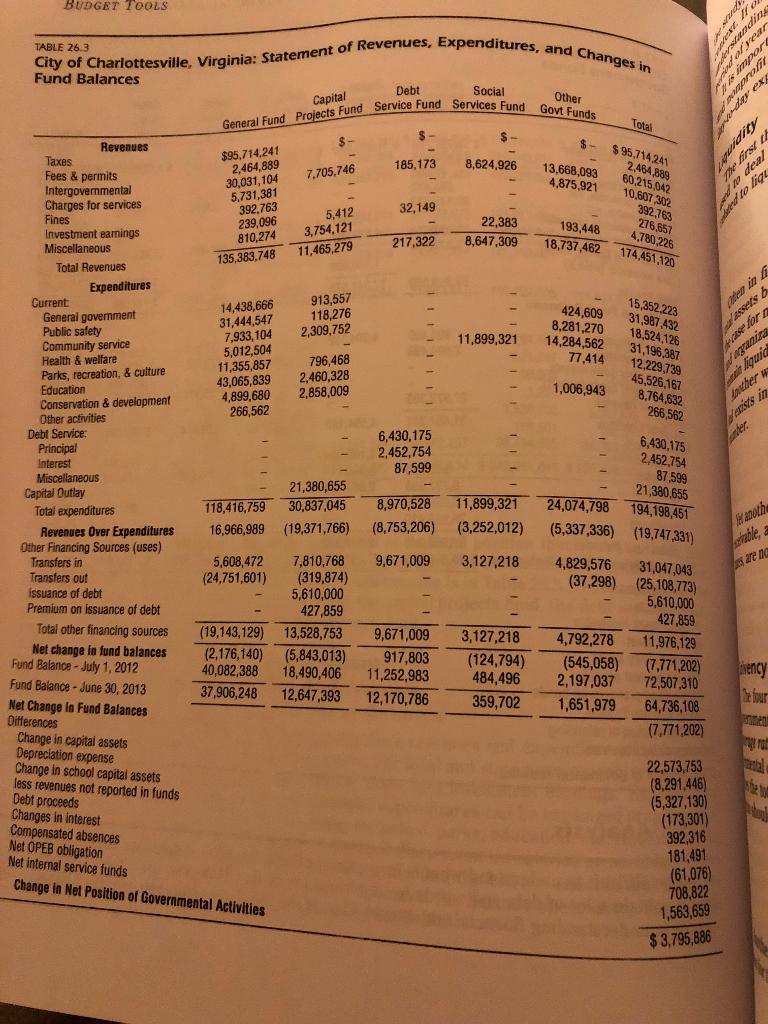
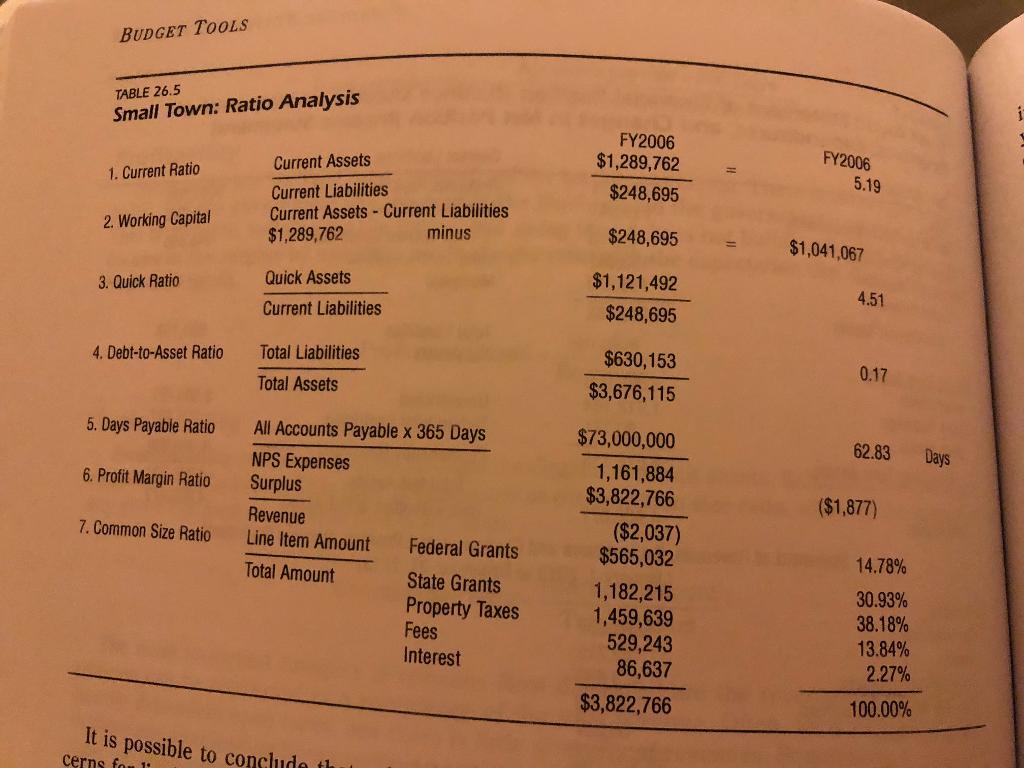
Using ratios to conduct financial analysis must be done with care. One year's worth of data is worth little; establishing a trend line over a period of years is the most useful approach. Using ratio analysis, we can examine liquidity, solvency, intergenerational equity, and revenue diversification. All of these factors can come together to provide a picture of the fiscal health of a government entity.
Go to https://study.sagepub.com/chen2e to access the tables and data for Module 26. Using the information from the zip file answer the following prompts.
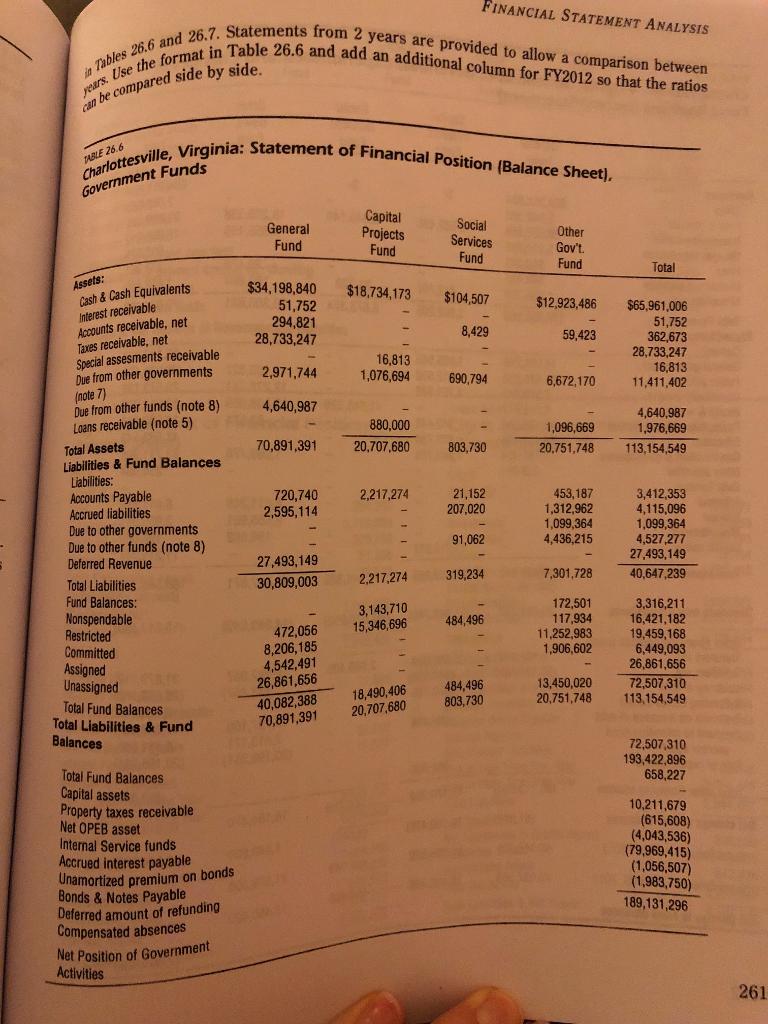
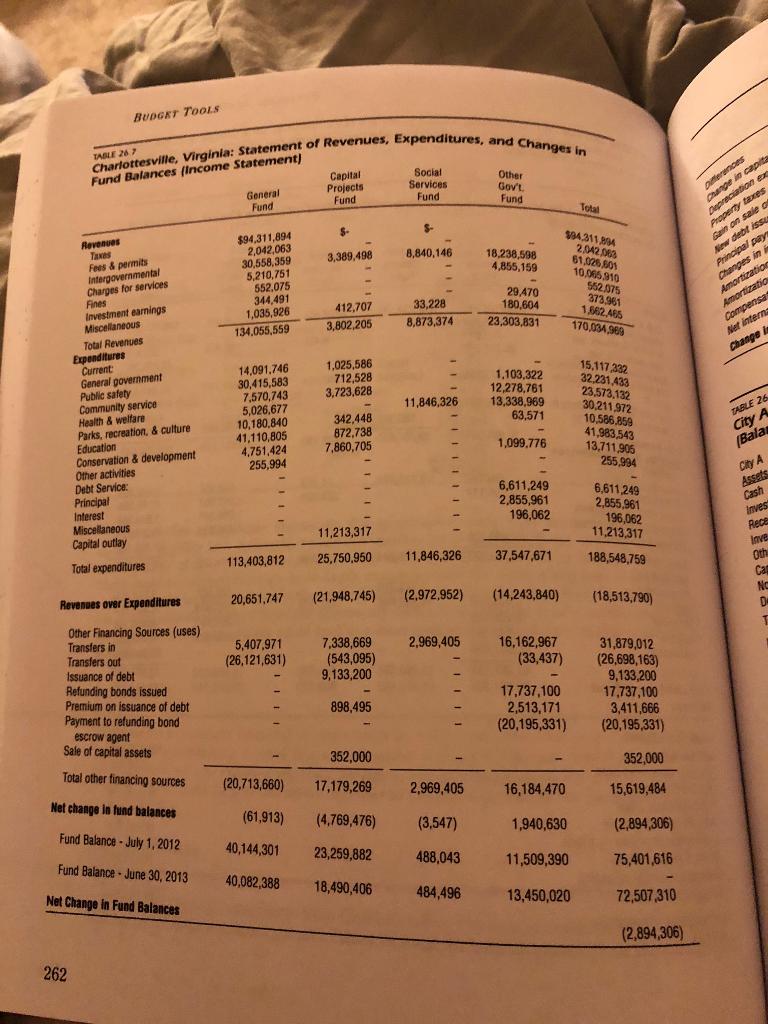
1. Use the financial statements from Charlottesville, Virginia, to conduct your own analysis. The statement from the year 2013 is in Tables 26.2 and 26.3; the statement from 2012 is provided in Tables 26.6 and 26.7. Statements from two years are provided to allow a comparison between years.
Use the format in Table 26.6 and add an additional column for FY2012 so that the ratios can be compared side by side.
2. City A's balance sheet is shown in Table 26.8. Calculate the following:
a. current ratio
b. working capital
c. quick ratio
d. the common-size ratios for cash, advance payments, receivables, and restricted assets.
3. City B's balance sheet is shown in Table 26.9. Calculate the following:
a. current ratio
b. working capital
c. quick ratio
d. the common-size ratios for cash, advance payments, receivables, and restricted assets.
This benchmark assignment assesses the following programmatic competency: 2.2: Analyze a budget and balance the sources and uses of funds.
Expert Answer:
Requirement 1Use the financial statements from Charlottesville Virginia to conduct your own analysis ... View the full answer


Principles of Incident Response and Disaster Recovery
ISBN: 978-1111138059
2nd edition
Authors: Michael E. Whitman, Herbert J. Mattord, Andrew Green
