

Question: Advanced physics A position-time graph for a particle moving along the x aids is shown in the figure below. x (m) 10 1 (5) 23
Advanced physics
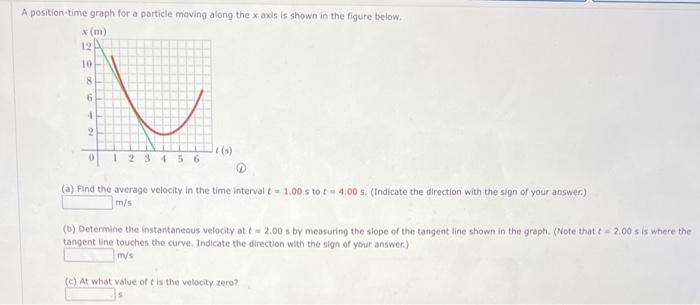
A position-time graph for a particle moving along the x aids is shown in the figure below. x (m) 10 1 (5) 23 4 56 (a) Find the average velocity in the time interval t = 1.00 s to r = 4.00's. (Indicate the direction with the sign of your answer) m/s (b) Determine the instantaneous velocity at f = 2.00's by measuring the slope of the tangent line shown in the graph. (Note that f - 2.00 s is where the tangent line touches the curve. Indicate the direction with the sign of your answer) m/s (c) At what value of t is the velocity zero
Step by Step Solution
There are 3 Steps involved in it
1 Expert Approved Answer
Step: 1 Unlock

Question Has Been Solved by an Expert!
Get step-by-step solutions from verified subject matter experts
Step: 2 Unlock
Step: 3 Unlock