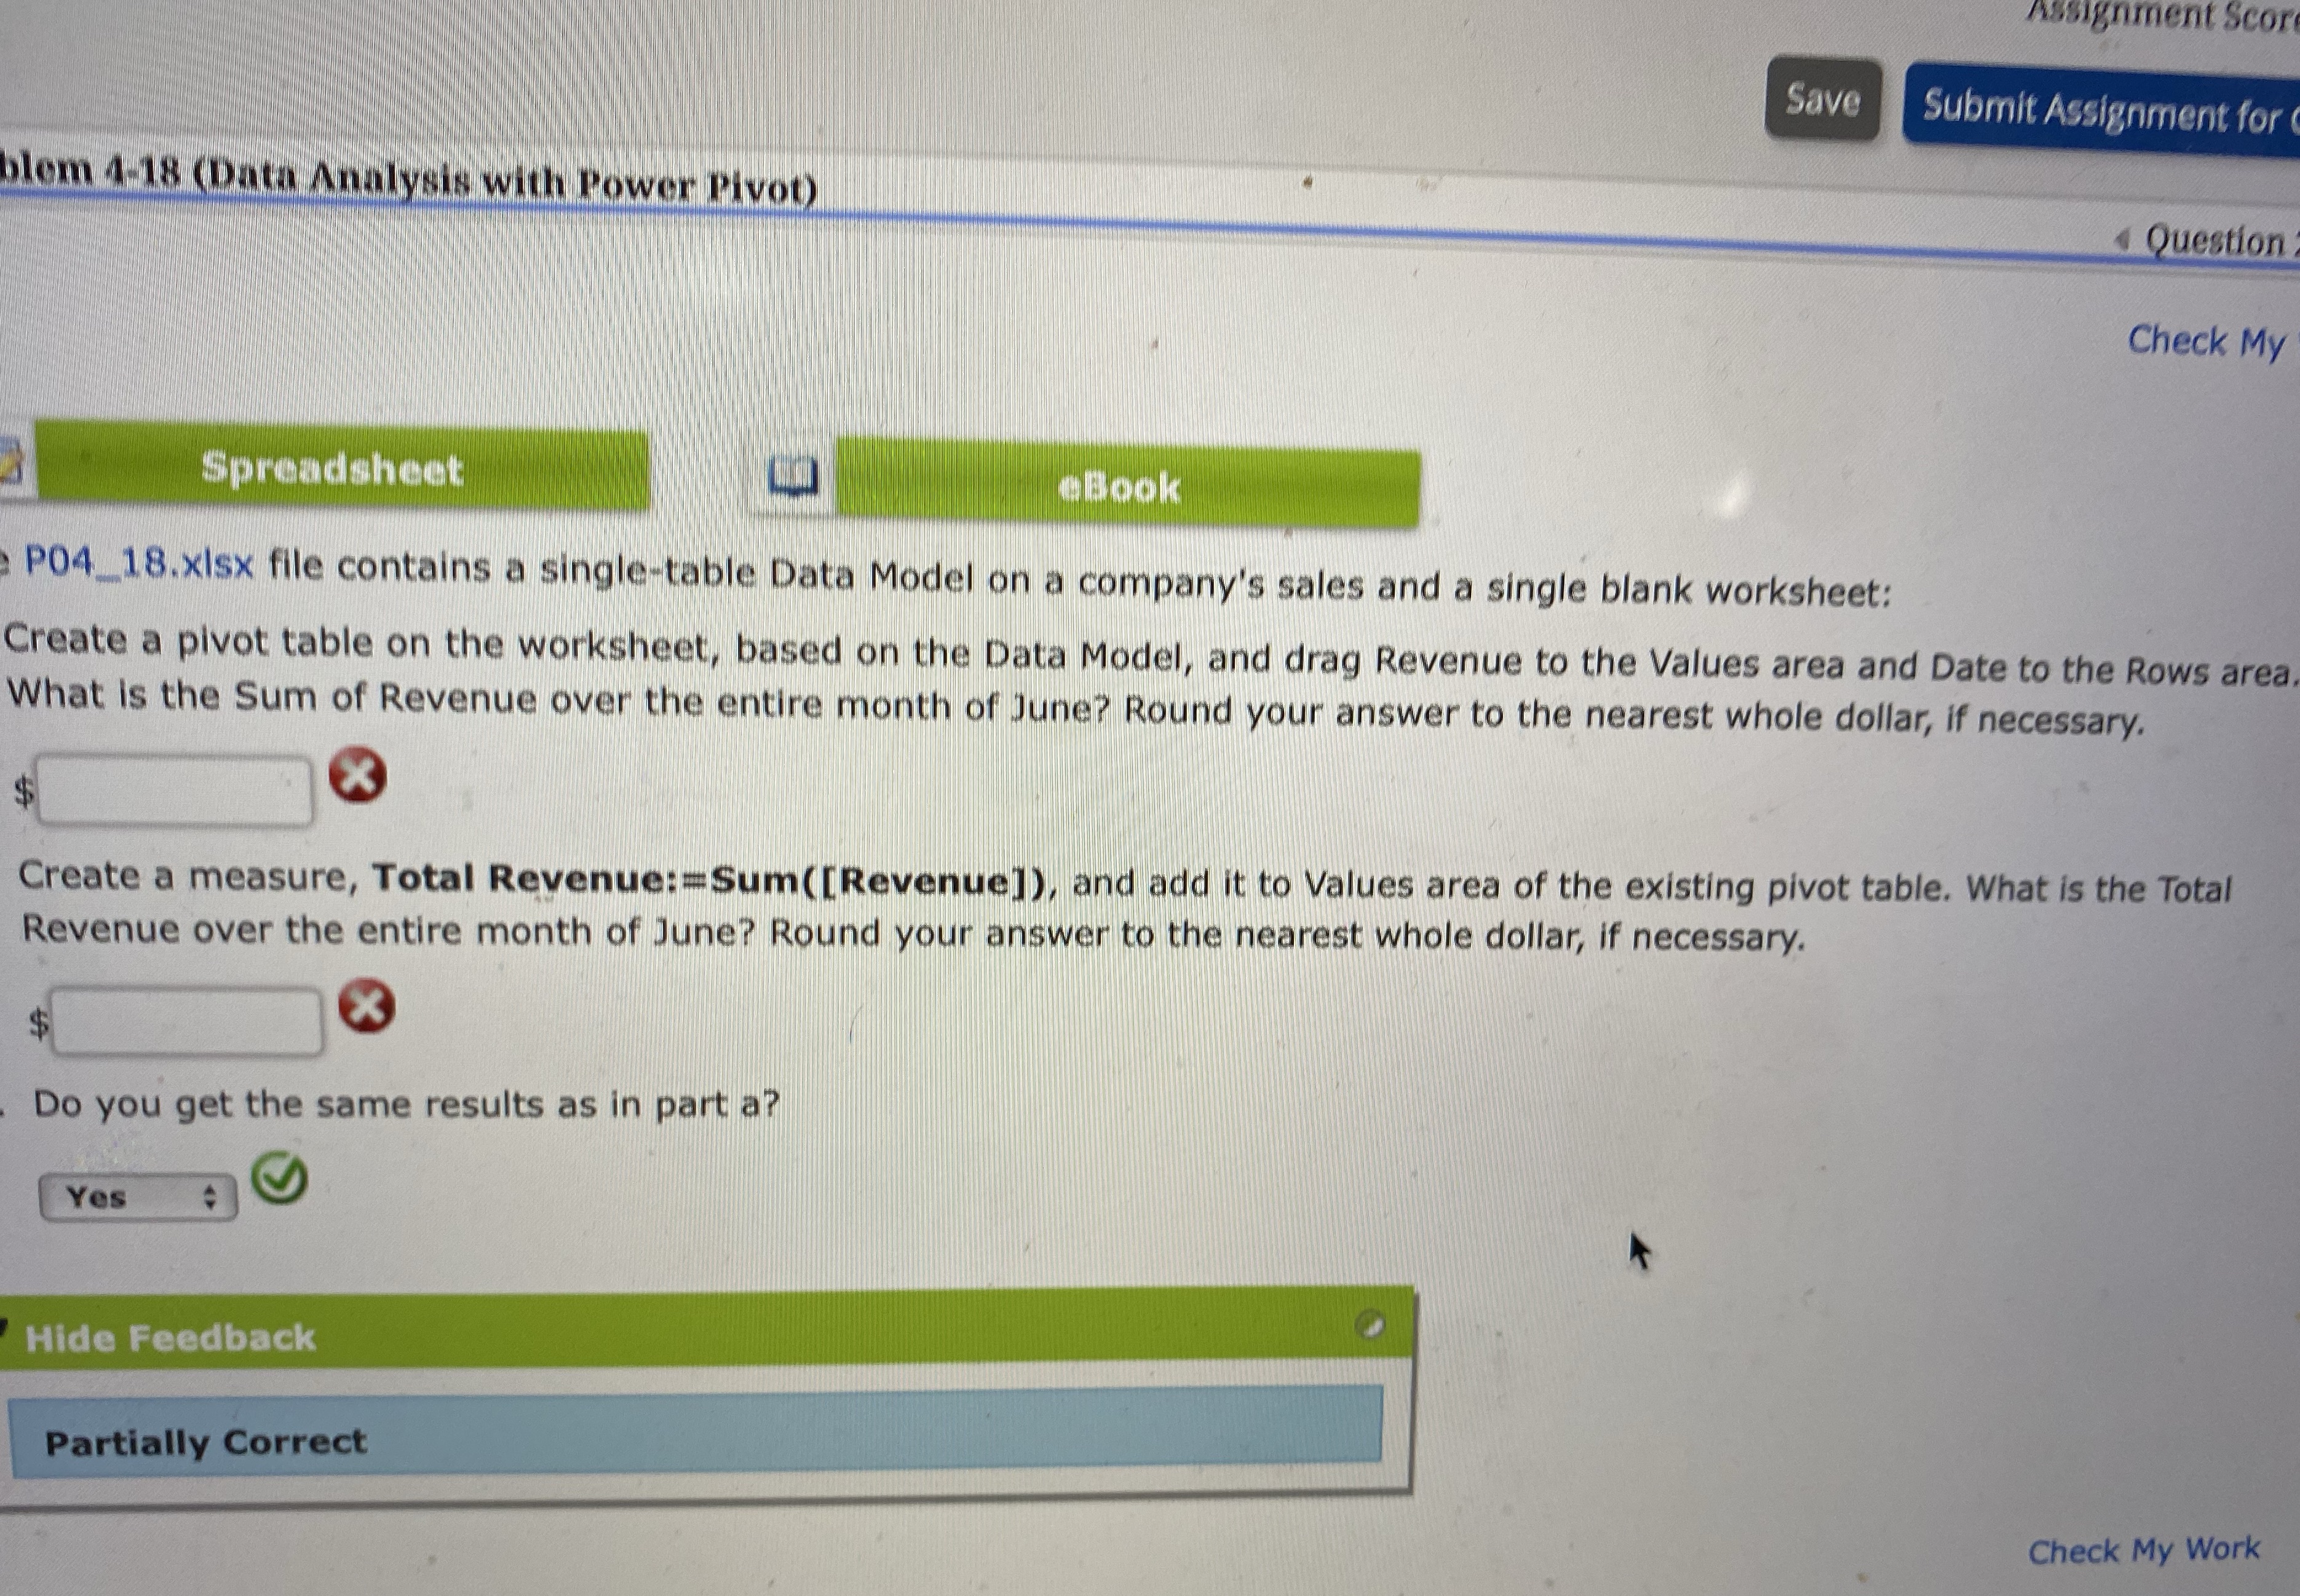
Question: Advanced Quantitative Analysis for Business Managers Assignment Scor Save Submit Assignment for blom 4-18 (Data Analysis with Power Pivot) Question Check My Spreadsheet eBook P04_18.xisx

Advanced Quantitative Analysis for Business Managers

Advanced Quantitative Analysis for Business
Assignment Scor Save Submit Assignment for blom 4-18 (Data Analysis with Power Pivot) Question Check My Spreadsheet eBook P04_18.xisx file contains a single-table Data Model on a company's sales and a single blank worksheet: Create a pivot table on the worksheet, based on the Data Model, and drag Revenue to the Values area and Date to the Rows area What is the Sum of Revenue over the entire month of June? Round your answer to the nearest whole dollar, if necessary. Create a measure, Total Revenue:=Sum([Revenue]), and add it to Values area of the existing pivot table. What is the Total Revenue over the entire month of June? Round your answer to the nearest whole dollar, if necessary. Do you get the same results as in part a? Yes Hide Feedback Partially Correct Check My Work

Step by Step Solution

There are 3 Steps involved in it

1 Expert Approved Answer
Step: 1 Unlock blur-text-image
Question Has Been Solved by an Expert!

Get step-by-step solutions from verified subject matter experts

Step: 2 Unlock
Step: 3 Unlock

Students Have Also Explored These Related Finance Questions!