

Question: (Advanced Statistics) Hi, I am working on this problem. There are both questions and answers, but I have no idea how to obtain the results
(Advanced Statistics)
Hi, I am working on this problem. There are both questions and answers, but I have no idea how to obtain the results below. I guess it is related to callibration (quarprog function in r), but dont know how to solve it.
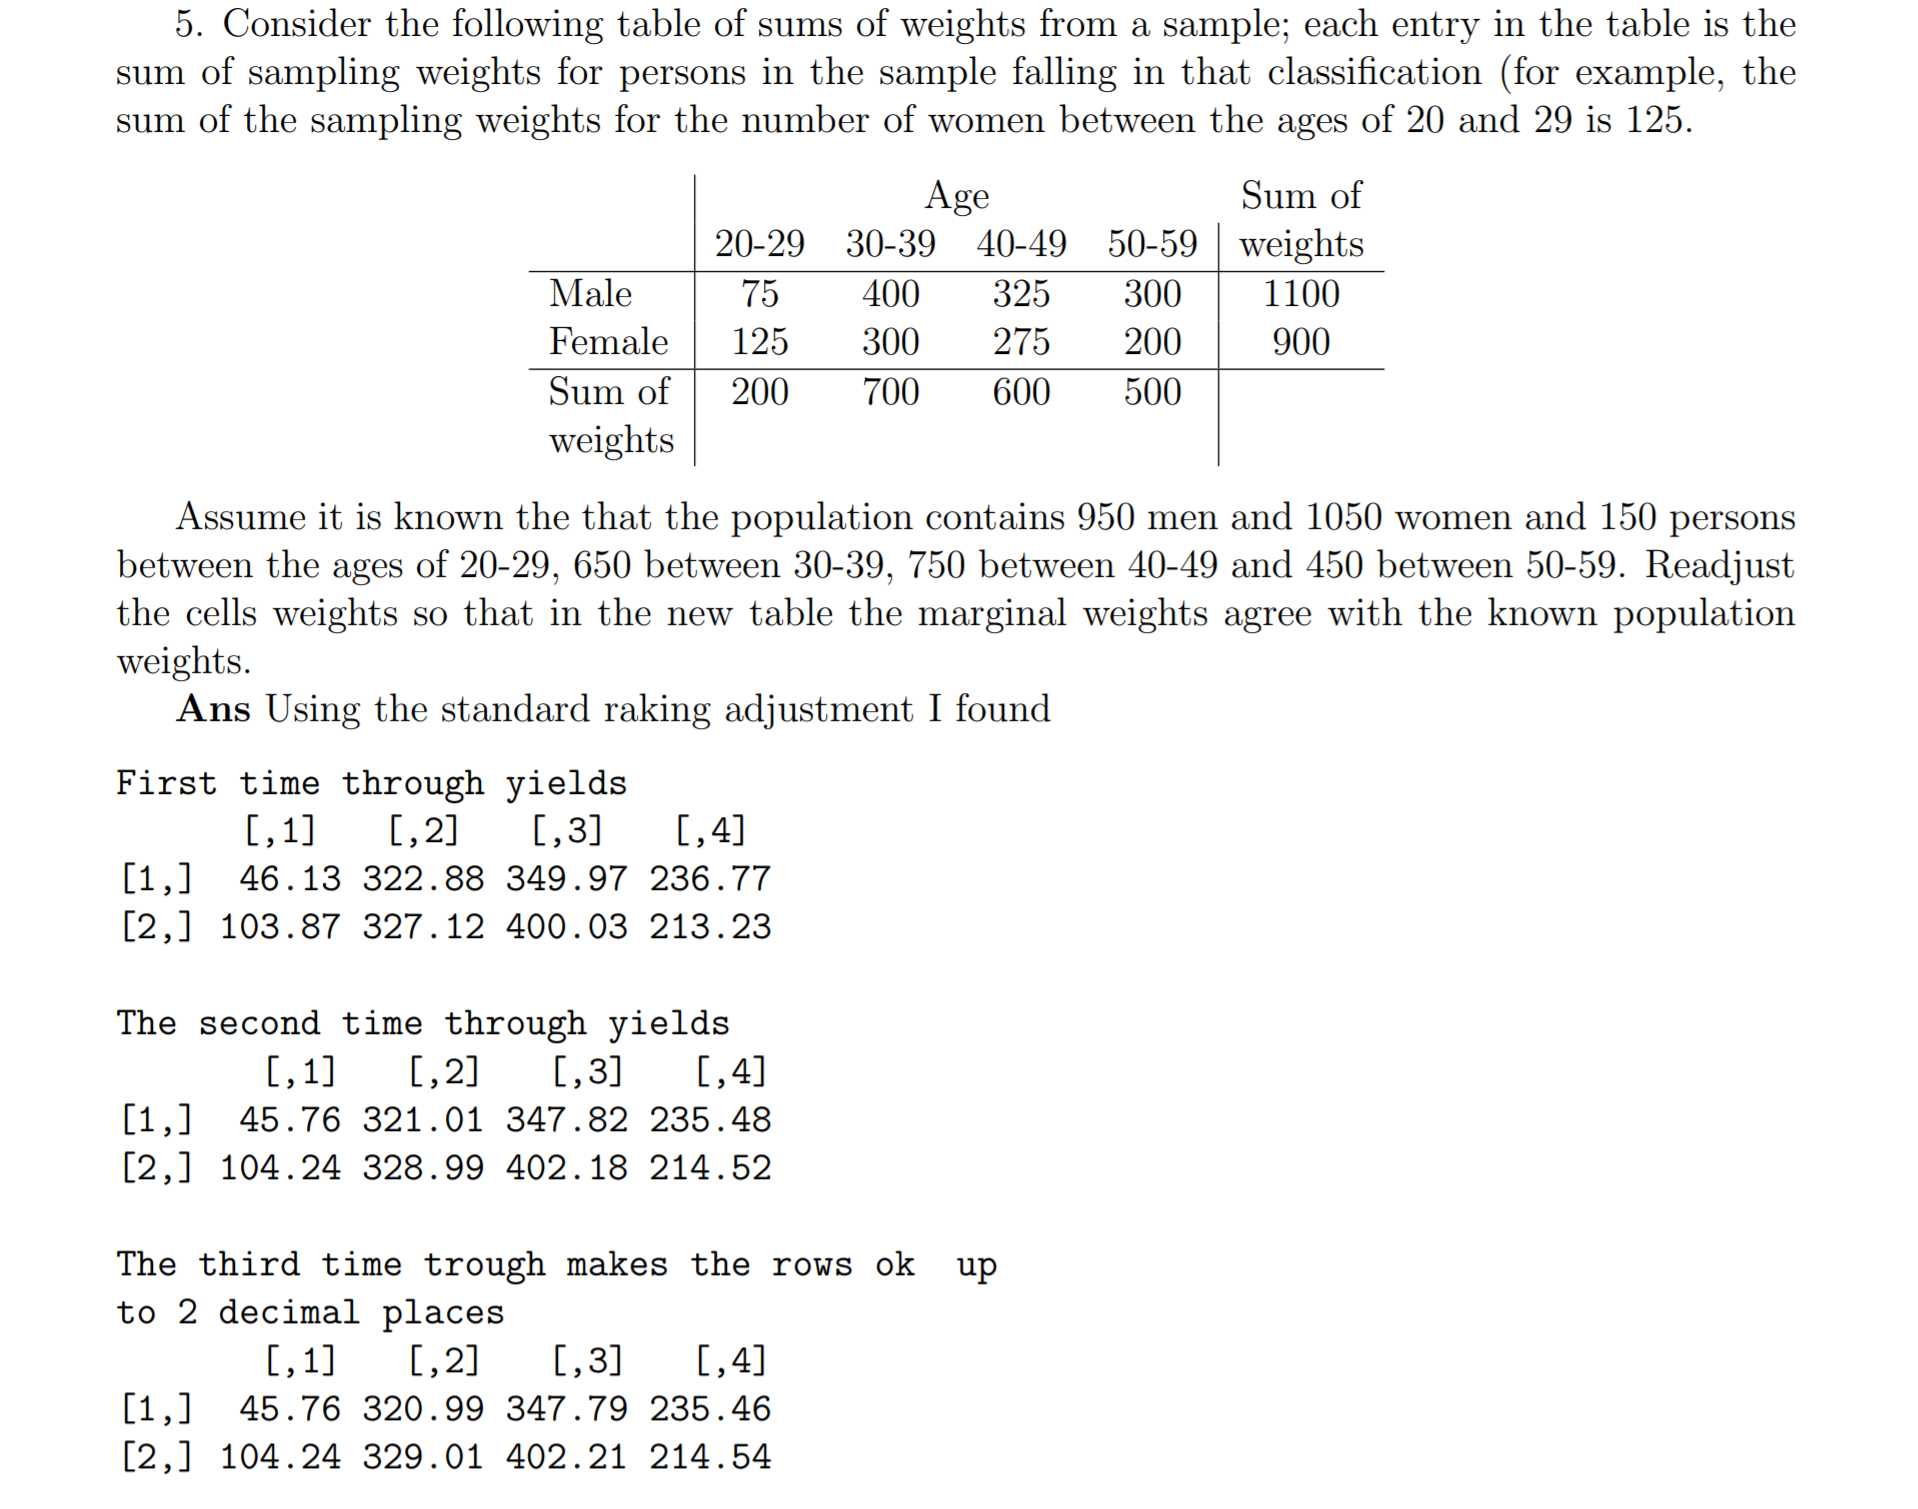
5. Consider the following table of sums of weights from a sample; each entry in the table is the sum of sampling weights for persons in the sample falling in that classication (for example, the sum of the sampling weights for the number of women between the ages of 20 and 29 is 125. Age Sum of 20-29 30-39 40-49 5059 1 weights Male Female 75 400 325 300 1 100 125 300 275 200 900 Sum of weights 200 700 600 500 ' Assume it is known the that the population contains 950 men and 1050 women and 150 persons between the ages of 2029, 650 between 3039, 750 between 4049 and 450 between 5059. Readjust the cells weights so that in the new table the marginal weights agree with the known population weights. Ans Using the standard raking adjustment I found First time through yields [,1] [,2] [,3] [,4] [1,] 46.13 322.88 349.97 236.77 [2,] 103.87 327.12 400.03 213.23 The second time through yields [,1] [,2] [,3] [,4] [1,] 45.76 321.01 347.82 235.48 [2,] 104.24 328.99 402.18 214.52 The third time trough makes to 2 decimal places [,1] [,2] [,3] the rows ok up [,4] [1,] 45.76 320.99 347.79 235.46 [2,] 104.24 329.01 402.21 214.54
Step by Step Solution
There are 3 Steps involved in it

Get step-by-step solutions from verified subject matter experts