

Question: a-f nothing missing there is nothing missing 8.6 The accompanying chart (Figure P8.6 shows the expected monthly profit or loss of Cypress Manufacturing Company within
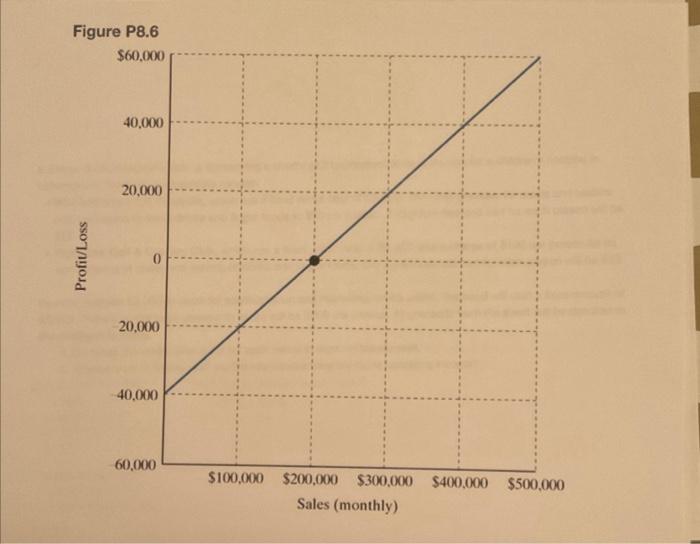
8.6 The accompanying chart (Figure P8.6 shows the expected monthly profit or loss of Cypress Manufacturing Company within the range of its monthly practical operating capacity. Using the information provided in the chart, answer the following questions. a. What is the company's break-even sales volume? b. What is the company's marginal contribution rate? c. What effect would a 5% decrease in selling price have on the break-even point in part (a)? d. What effect would a 10% increase in fixed costs have on the marginal contribution rate in part (b)? e. What effect would a 6% increase in variable costs have on the break-even point in part (a)? f. If the chart also refiects $20,000 monthly depreciation expenses, compute the sales volume at the break-even point for cash costs. Figure P8.6
Step by Step Solution
There are 3 Steps involved in it

Get step-by-step solutions from verified subject matter experts