

Question: Afrequency distribution is shown below. Complete parts (a) and (b). The number of televisions per household in a small town Televisions 0 1 2 3

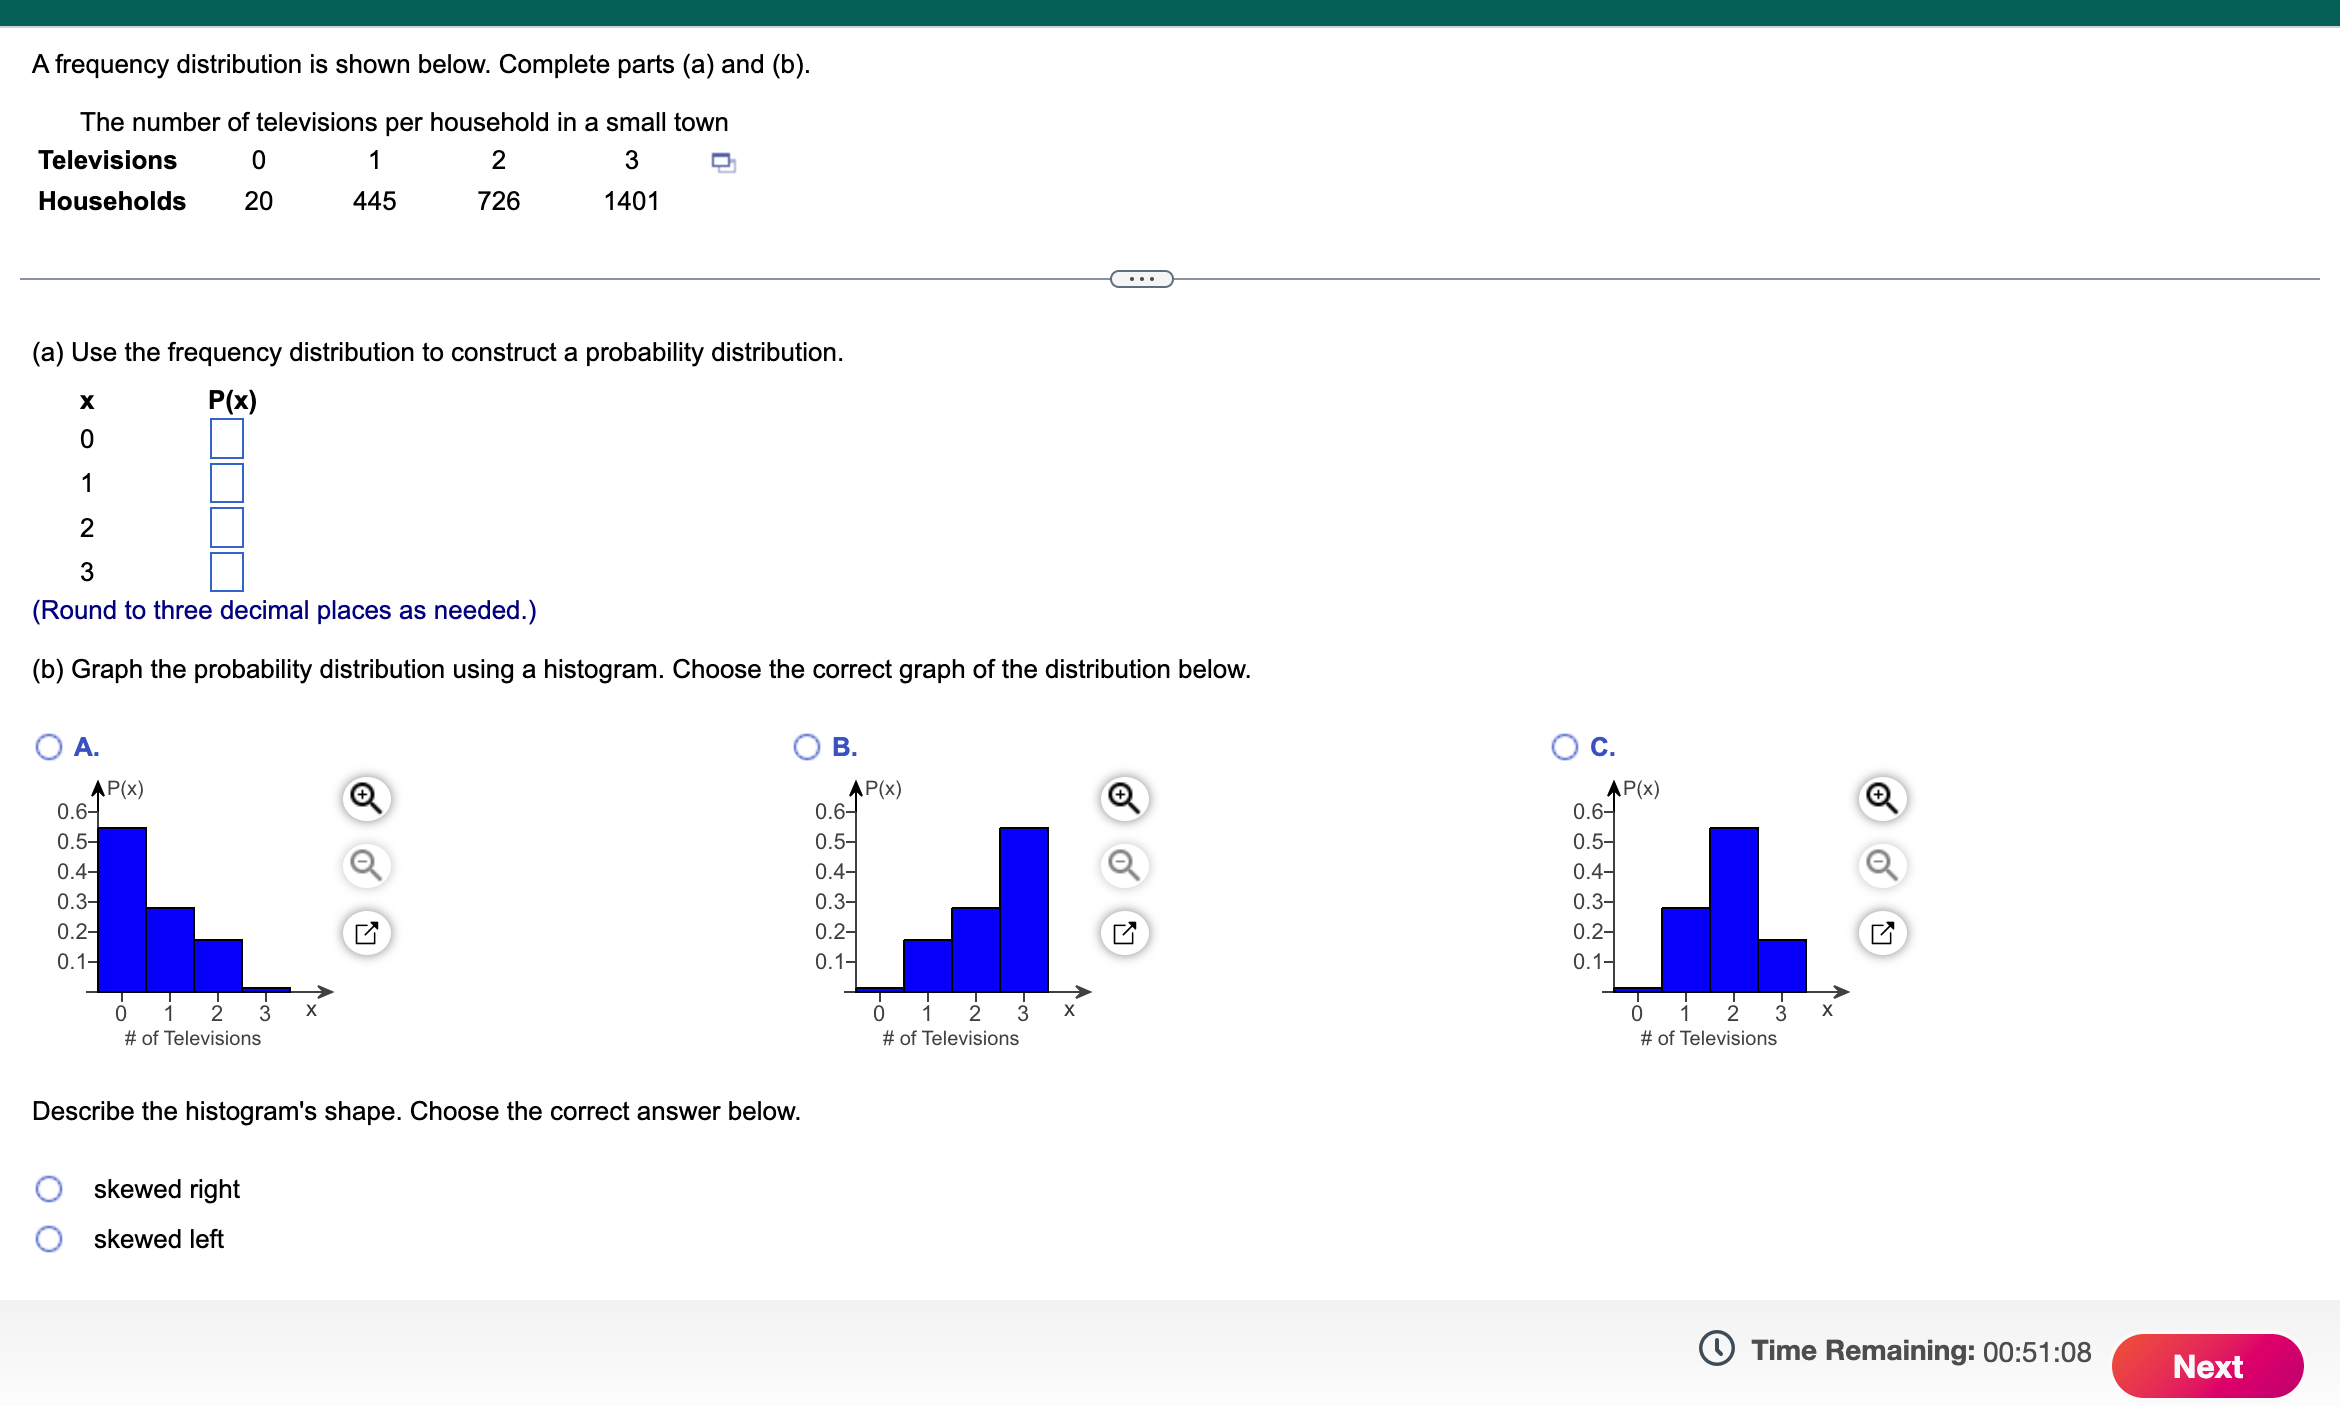
Afrequency distribution is shown below. Complete parts (a) and (b). The number of televisions per household in a small town Televisions 0 1 2 3 El Households 20 445 726 1401 (a) Use the frequency distribution to construct a probability distribution. x P(x) 0 1 2 3 (Round to three decimal places as needed.) (b) Graph the probability distribution using a histogram. Choose the correct graph of the distribution below. {:3 A. (j: a; C. P(x) P(X) 0'6 0' 0' 0.6 Q 05 0.5 04 Q Q 0.4 Q 0.3 0.3 0.2 D}. IE 0.2 E 0.1 0.1 0 1 2 3 X 0 1 2 3 X 0 1 2 3 X # of Televisions # oi Televisions # of Televisions Describe the histogram's shape. Choose the correct answer below. Ci skewed right skewed left (9 Time Remaining: 00:51:08 m
Step by Step Solution
There are 3 Steps involved in it

Get step-by-step solutions from verified subject matter experts