

Question: After a thorough analysis, you realize that there is a possibility of expanding the ice cream business to other regi ons. By using the data
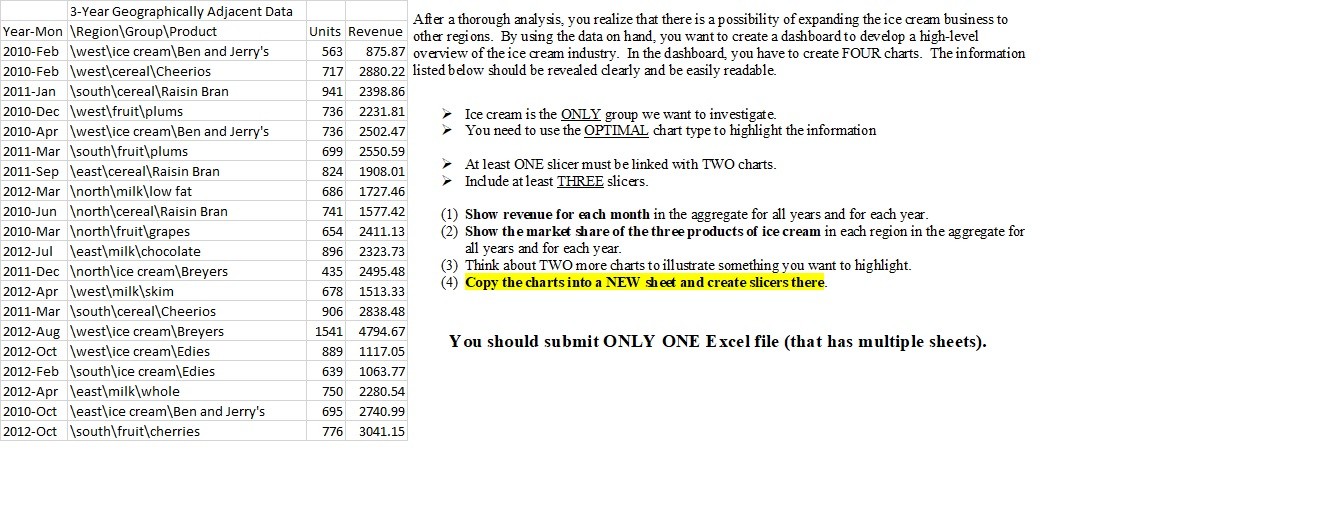
After a thorough analysis, you realize that there is a possibility of expanding the ice cream business to
other regi ons. By using the data on hand, you want to create a dashboard to develop a highlevel
overview of the ice cream industry. In the dashboard, you have to create FOUR charts. The information
listed below should be revealed clearly and be easily readable.
Ice cream is the ONLY group we want to investigate.
You need to use the OPTIMAL chart type to highlight the information
At least ONE slicer must be linked with TWO charts. Show revenue for each month in the aggregate for all years and for each year.
Show the market share of the three products of ice cream in each region in the aggregate for
all years and for each year.
Think about TWO more charts to illustrate something you want to highlight.
Copy the charts into a NEW sheet and create slicers there.
You should submit ONLY ONE Excel file that has multiple sheets
Step by Step Solution
There are 3 Steps involved in it
1 Expert Approved Answer
Step: 1 Unlock

Question Has Been Solved by an Expert!
Get step-by-step solutions from verified subject matter experts
Step: 2 Unlock
Step: 3 Unlock