Question: After completing the reading assignment, case study to critique. In your critique, summarize the central issue, then provide your point of view around the metrics
After completing the reading assignment, 
 case study to critique. In your critique, summarize the central issue, then provide your point of view around the metrics that were used, data collection methods, the decisions that were made as a result of the data collected, and level of success. Be sure to include the rationale for your point of view.
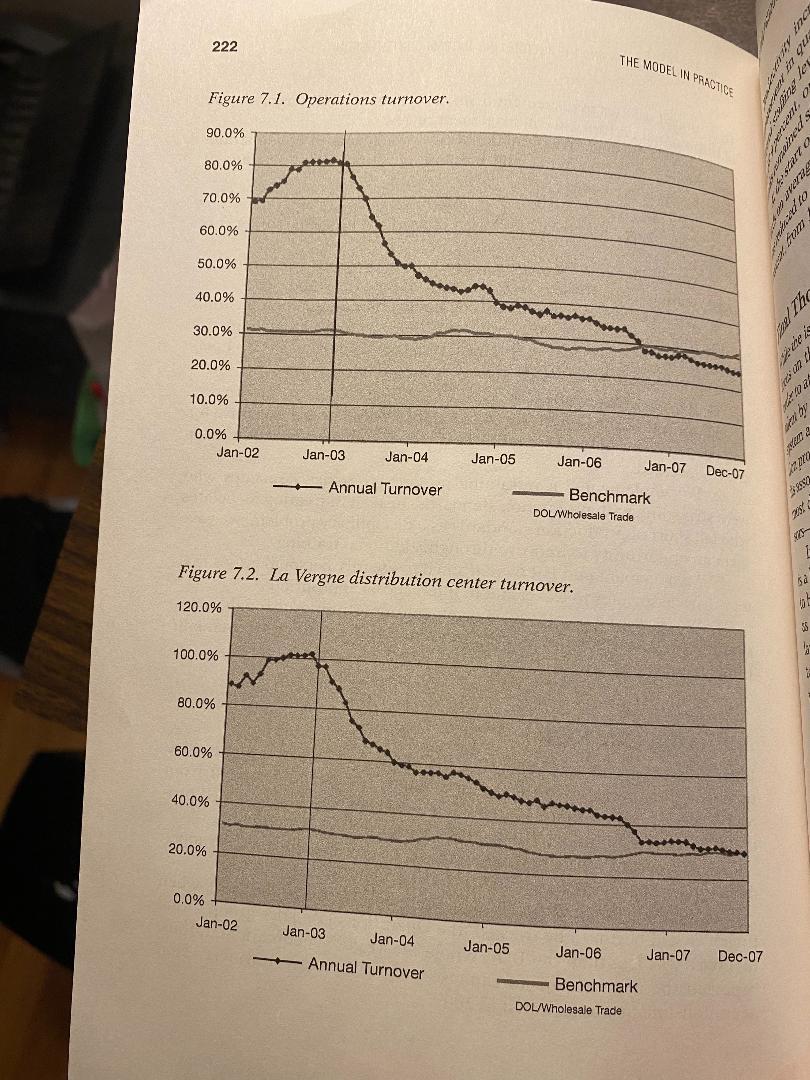
Impacting Productivity and the Bottom Line: Ingram Content Group Wayne M. Keegan, Chief Human Resources Officer The Ingram Content Group (ICG) is part of a long tradition of successful companies built by the Ingram family. Dedicated to helping content reach its designation by providing a broad range of physical and digital services, Ingram has been a partner to publishers, booksellers, and librar- ies for more than four decades. ICG leads the industry in physical distri- bution, supply chain management, and fulfillment services with access to all markets both domestic and international. On average, ICG ships 2.4 million units each week to over 85,000 customers from four distribution centers. Employee turnover had been a chronic problem for Ingram's distri- bution and fulfillment division for years, rising steadily until it hit a rate of 81.7 percent enterprise-wide at the end of 2002, and 102 percent in our flagship distribution center in La Vergne, Tennessee. For Operations/ Logistics leadership, the revolving door of talent was disruptive in its efforts to operate at best-of-industry standards. For the rest of the C-staff, the attitude was one of resignation after all, these were tough, entry- level, blue-collar jobs in a warehouse/distribution environment with pro- duction standards. In essence, high turnover in the Operations groups was viewed as a fact of life. 217 disruptive tion, resources, and efforts of the organization on this matter. by a separation event, and (2) using the more simple calculation of sit Getting the Attention of Leadership For Operations/Logistics leadership, excessive turnover was a factor in its efforts to effectively manage its facilities. Intuitively, we all knew that there was a significant human capital expense negatively impacting the bottom line. We were tracking the turnover data and benchmarking that against the data provided by the Department of Labor for Wholesale Trade. However, this practice alone was not capturing the financial impact of excessive turnover in terms that would allow manage- ment to make a cost/benefit determination of whether to focus the atten- Initially, we explored two highly accepted methods for determining the cost of turnover: (1) capturing the individual expense items impacted months of base pay plus benefits for each nonexempt separation and one year for each exempt separation. However, while these are valid and widely used methodologies for calculating the cost of turnover, the expense numbers reported from these methods were such that they failed to pass the "reasonableness" test. When outlining the expense implications to executive management of any human capital issue, the human resources leader needs to be aware that even C-staff or board leaders have a tipping point for reality, or reasonableness. Presenting a number that reaches a level where the sheer size, no matter how well laid out, simply shuts down the audience's willingness to accept the number as valid will significantly reduce the chances of influencing that executive leadership on the need to take action. For example, in our case, the total number of nonexempt/hourly separations for 2002 in the Operations/Logistics group alone was 1,821. However, even if we adjusted to include only those separations that exceed the DOL's Wholesale Trade benchmark, bringing the total down to 1,155, using the simple standard calculation at a rate of $26,000 per separation (base pay + benefits), we would be reporting a cost of exces- sive turnover for just this group of a little north of $30 million. Even for a company with top line sales of over $1 billion at the time, making a pitch that reducing turnover to the level of the benchmark would add $30 million to the bottom line would not pass the reasonableness test. Furthermore, we would have lost our audience and, more important, lost an opportunity to address a serious issue that was costing the company significant pretax dollars. We knew that excessive turnover was disruptive to any efforts to maintain best-in-industry standards in the Operations/Logistics group, and we knew that this expense was a human capital loss significantly formula that would capture the expense analytics used by the Operations impacting the bottom line. The challenge we faced was to construct a we sought a formula that would establish a model for human capital value that could accurately identify the cost of excessive turnover, but and Finance groups in measuring operational performance. Therefore, also pass the reasonableness test in order to get the attention of senior leadership and to take action. Crafting the Right Formula to Gain Leadership Support neyti agent de ds ETTER heres Partnering with our Operations/Logistics colleagues, we analyzed the key operational and financial metric for their divisions: cost per unit, or CPU. Production standards had been established for the majority of the posi- tions, so we evaluated the labor costs in relation to unit/line production standards. From our collective experience, we knew that there was a significant gap between a tenured departing associate and a newly hired replace- ment regarding production output versus production standard. As a rule of thumb, we had accepted a thirty-day ramping-up period for the aver- age new hire to perform at standard. However, this assumption had never been validated through a scientific production analysis. An analysis of the average production rates for new hires in 2002 revealed that the ramping- up time in achieving the production standard was greater than assumed. For every replacement of an associate with six months or more of service, who was averaging 106 percent of production standard, the newly hired replacement initially performed at an average of only 50 per- cent of standard, 83 percent at three months of service, 95 percent for the months three to six months, and finally achieving the production stan- dard after six months of employment. Clearly, there was a dramatic drop in productivity for each separation incident, and the challenge was to craft a metric that would capture that financial impact. We came up with the following metric for our human capital value model: am Unit/line labor Average production standard Separation expense Average new hire production 0-6 mos, service costs is half the battle in rablish the metras 221 actors Warranty d track the series . All of these met ated to leadership achieving turnover goals. C. Rewards ditions. asuring turmater nst data provided ate. /WP4CTING PRODUCTIVITY AND THE BOTTOM LINE: INGRAM CONTENT GROUP Operations Logistics management team, as well as the HR team, as part of their annual performance management reviews. 5. We established cross-functional turnover teams to create strate- gies, implement action items, and measure effectiveness as a means of 1. We ensured that base pay was competitive with local market con- 2. We implemented a pay-for-performance program system for the hourly team that was based on production and quality standards. of the importance of the 401k program. For the Operations/Logistics 3. We secured their futures through education and communication group during this five-year period, participation rose from 25 to 84 per- cent, surpassing the Wholesale Trade benchmark of 72 percent. D. Associate Relations 1. We established quarterly roundtables chaired by the executive for each department; notes were published, along with specific action to be addressed. 2. We implemented a retraining program to assist associates who were struggling with production standards. Instead of treating associates who fell short of production standards as a disciplinary problem, we gave them an opportunity to improve through additional training, 3. Management and HR were trained to identify personal issues that may drive associates to leave, and to intervene as appropriate. 4. We increased employee engagement opportunities through inclu- sion on teams such as the Safety Committee and process improvement/ LEAN teams. assessment to that would enhance rument to all apa for all hourly pasi of scrutiny as *** In our flagshipdis ENCON We screened 3.0 we screened 6,869 KTO E CE IN a tailored ongoirt in the Operations y focused on Team company and ar team. Achieving Our ROI Within five years of implementing the strategies to address excessive turnover, turnover for the Operations/Logistics groups dropped from livered a series of cate leadershipa through fokor lication of new ntinued manage 81.7 to 25.5 percent, thereby achieving a cost savings tied to added pro- ductivity of $13.4 million over the five-year period. See Figure 7.1. In our flagship distribution center in La Vergne, turnover dropped during the same period from 102 to 28.8 percent. See Figure 7.2. In 2006, for the first time in the company's history since 1999, when turnover had begun to be tracked, the Operations Logistics group's total turnover was less than the DOL/Wholesale Trade benchmark and, thus, accomplishment was repeated in 2007. reported the first year of no expense tied to excessive turnover. That was evaluated ills as measure acus ar Ascendana 222 THE MODEL W PRACTICE ne. Figure 7.1. Operations turnover. lo 90.0% gud 80.0% WWW starta 70.0% 60.0% 50.0% 40.0% 30.0% 20.0% 10.0% 0.0% Jan-02 Jan-03 Jan-04 Jan-05 Jan-06 Jan-07 Dec-07 Annual Turnover Benchmark DOL/Wholesale Trade - Figure 7.2. La Vergne distribution center turnover. 58 WE 120.0% 100.0% 80.0% 60.0% 40.0% 20.0% 0.0% Jan-02 Jan-03 Jan-04 Jan-05 Jan-06 Jan-07 Dec-07 Annual Turnover Benchmark DOL/Wholesale Trade 223 improvement IMPACTING PRODUCTIVITY AND THE BOTTOM LINE; INGRAM CONTENT GROUP Productivity increases tied to the reduction in turnover and to the in quality of hires during the five years of this study also allowed staffing levels to be reduced in the Operations/Logistics groups by 39.9 percent, or 913 associates, while volume in the distribution net- works remained steady. dards on average at 180 days of hire; by the end of 2007, that number At the start of this study in 2003, new hires reached production stan- was reduced to 88 days. Additionally, the volume of staffing dropped 55.7 percent, from 1,799 hires in 2002 to 796 by 2007. Final Thoughts While the issue of excessive turnover has been addressed, we continue to Dec-12 focus on the quality of our hires in the Operations/Logistics groups in order to attract the best talent. We also continue our efforts to retain that talent by enhancing our onboarding process, ensuring that our rewards system and benefits are competitive, and through a robust communica- tion program, ensuring that Ingram management never loses touch with its associates. In addition, we continue to ensure that those who have the most direct contact with the associates-our Team Leads and Supervi- sorsare provided with effective ongoing leadership development. In the twenty-first century, maximizing a company's human capital is a key competitive factor for success. If human resources leadership is to be effective and add value in support of this effort, they must operate as business leaders who happen to concentrate in the field of HR. The language of the C-staff and the boardroom is numbers. Analytics applied to human capital issues are essential in providing the predictive data that will allow leadership to manage this valuable asset more effectively. Note 1. Profit Sharing/401k Council of America


