

Question: After developing the spreadsheet, Use the Seal Point Surfwear Spreadsheet Model to Answer the following questions: 1. What MOQ would produce the same total relevant
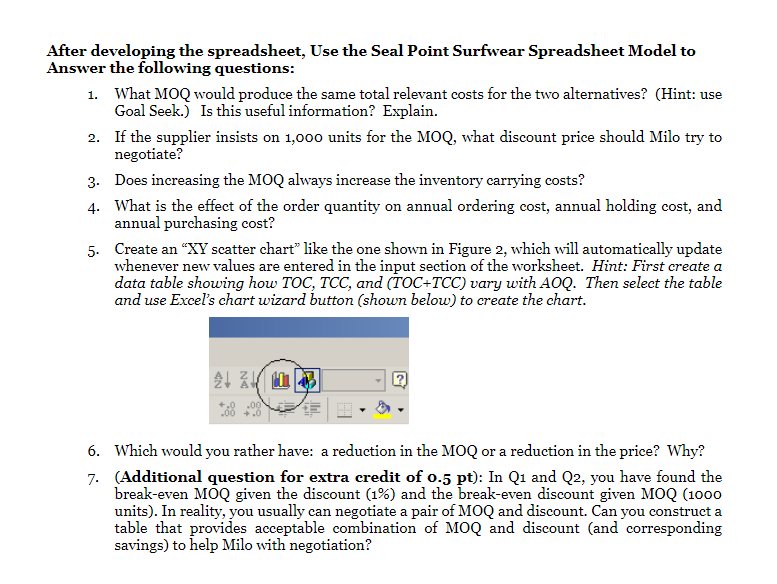
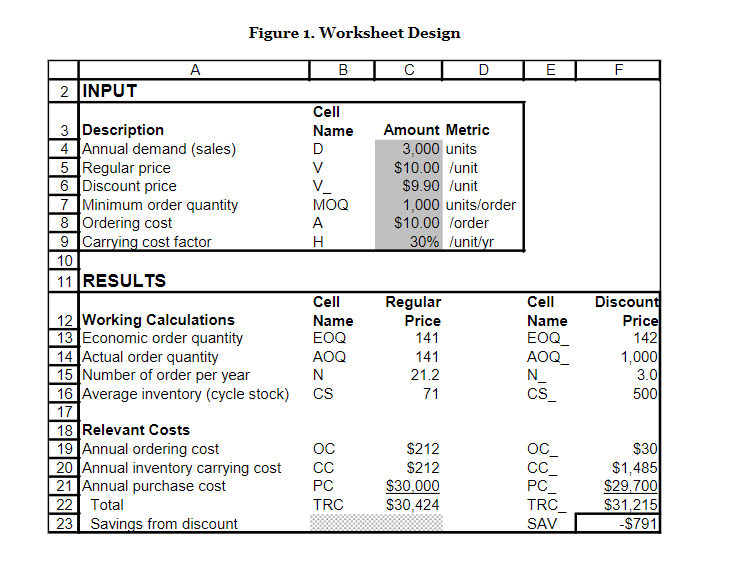
After developing the spreadsheet, Use the Seal Point Surfwear Spreadsheet Model to Answer the following questions: 1. What MOQ would produce the same total relevant costs for the two alternatives? (Hint: use Goal Seek.) Is this useful information? Explain. 2. If the supplier insists on 1,000 units for the MOQ, what discount price should Milo try to negotiate? 3. Does increasing the MOQ always increase the inventory carrying costs? 4. What is the effect of the order quantity on annual ordering cost, annual holding cost, and annual purchasing cost? 5. Create an "XY scatter chart" like the one shown in Figure 2, which will automatically update whenever new values are entered in the input section of the worksheet. Hint: First create a data table showing how TOC, TCC, and (TOC+TCC) vary with AOQ. Then select the table and use Excel's chart wizard button (shown below) to create the chart. 21 2u 8.3 a 6. Which would you rather have: a reduction in the MOQ or a reduction in the price? Why? 7. (Additional question for extra credit of 0.5 pt): In Q1 and Q2, you have found the break-even MOQ given the discount (1%) and the break-even discount given MOQ (1000 units). In reality, you usually can negotiate a pair of MOQ and discount. Can you construct a table that provides acceptable combination of MOQ and discount (and corresponding savings) to help Milo with negotiation? Figure 1. Worksheet Design D E F Amount Metric 3,000 units $10.00 /unit $9.90 /unit 1,000 units/order $10.00 Vorder 30% /unit/yr CD A B 2 INPUT Cell 3 Description Name 4 Annual demand (sales) D 5 Regular price V 6 Discount price V 7 Minimum order quantity MOQ 8 Ordering cost A 9 Carrying cost factor H 10 11 RESULTS Cell 12 Working Calculations Name 13 Economic order quantity EOQ 14 Actual order quantity AOQ 15 Number of order per year N 16 Average inventory (cycle stock) cs 17 18 Relevant Costs 19 Annual ordering cost OC 20 Annual inventory carrying cost CC 21 Annual purchase cost PC 22 Total TRC 23 Savings from discount Regular Price 141 141 21.2 71 Cell Name EOQ_ AOQ N CS Discount Price 142 1,000 3.01 500 $212 $212 $30,000 $30,424 OC CC PC TRC SAV $30 $1,485 $29,700 $31,215 -$791 After developing the spreadsheet, Use the Seal Point Surfwear Spreadsheet Model to Answer the following questions: 1. What MOQ would produce the same total relevant costs for the two alternatives? (Hint: use Goal Seek.) Is this useful information? Explain. 2. If the supplier insists on 1,000 units for the MOQ, what discount price should Milo try to negotiate? 3. Does increasing the MOQ always increase the inventory carrying costs? 4. What is the effect of the order quantity on annual ordering cost, annual holding cost, and annual purchasing cost? 5. Create an "XY scatter chart" like the one shown in Figure 2, which will automatically update whenever new values are entered in the input section of the worksheet. Hint: First create a data table showing how TOC, TCC, and (TOC+TCC) vary with AOQ. Then select the table and use Excel's chart wizard button (shown below) to create the chart. 21 2u 8.3 a 6. Which would you rather have: a reduction in the MOQ or a reduction in the price? Why? 7. (Additional question for extra credit of 0.5 pt): In Q1 and Q2, you have found the break-even MOQ given the discount (1%) and the break-even discount given MOQ (1000 units). In reality, you usually can negotiate a pair of MOQ and discount. Can you construct a table that provides acceptable combination of MOQ and discount (and corresponding savings) to help Milo with negotiation? Figure 1. Worksheet Design D E F Amount Metric 3,000 units $10.00 /unit $9.90 /unit 1,000 units/order $10.00 Vorder 30% /unit/yr CD A B 2 INPUT Cell 3 Description Name 4 Annual demand (sales) D 5 Regular price V 6 Discount price V 7 Minimum order quantity MOQ 8 Ordering cost A 9 Carrying cost factor H 10 11 RESULTS Cell 12 Working Calculations Name 13 Economic order quantity EOQ 14 Actual order quantity AOQ 15 Number of order per year N 16 Average inventory (cycle stock) cs 17 18 Relevant Costs 19 Annual ordering cost OC 20 Annual inventory carrying cost CC 21 Annual purchase cost PC 22 Total TRC 23 Savings from discount Regular Price 141 141 21.2 71 Cell Name EOQ_ AOQ N CS Discount Price 142 1,000 3.01 500 $212 $212 $30,000 $30,424 OC CC PC TRC SAV $30 $1,485 $29,700 $31,215 -$791
Step by Step Solution
There are 3 Steps involved in it

Get step-by-step solutions from verified subject matter experts