

Question: After estimating a regression model, we should evaluate how well the model fits the observed inflation data. The key statistics are highlighted with blue in
After estimating a regression model, we should evaluate how well the model fits the observed inflation data. The key statistics are highlighted with blue in the screenshot above: a) The R-squared statistic measures the percent of the variation in the dependent variable (PCE) that is explained by the fitted regression model, so higher values are preferred. For example, R2 = 0.50 indicates that the fitted model explains 50% of the variation in annual PCE inflation. As long as the model includes an intercept or constant term (const), the R-squared statistic takes values between zero and one. We can always increase R-squared by adding new variables to the model, even if they do not have any reasonable relationship to PCE. The adjusted R-squared statistic accounts for this drawback of R-squared, and its value only increases if a new variable has a substantive impact on the model fit. Please state how we should interpret the R-squared statistic (0.374514) from this base model.
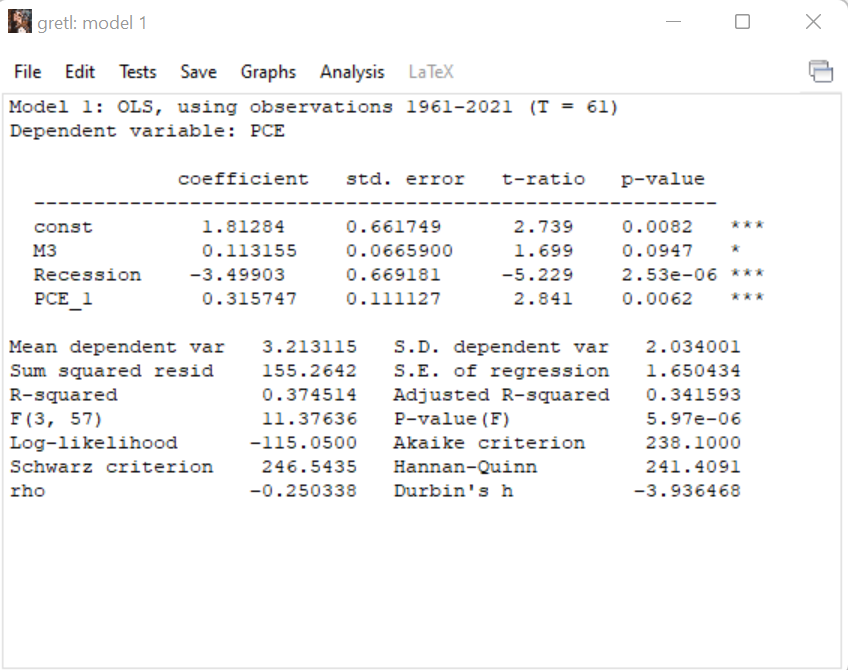
gretl: model 1 0 X File Edit Tests Save Graphs Analysis LaTex Model 1: OLS, using observations 1961-2021 (T = 61) Dependent variable: PCE coefficient std. error t-ratio p-value const 1 . 81284 0 . 661749 2. 739 0 . 0082 M3 0. 113155 0. 0665900 1. 699 0 . 0947 Recession -3.49903 0. 669181 -5.229 2.53e-06 * * * PCE 1 0. 315747 0 . 111127 2 . 841 0 . 0062 Mean dependent var 3. 213115 S. D. dependent var 2 . 034001 Sum squared resid 155. 2642 S.E. of regression 1 . 650434 R-squared 0 . 374514 Adjusted R-squared 0 . 341593 F (3, 57) 11 . 37636 P-value (F) 5.97e-06 Log-likelihood -115 . 0500 Akaike criterion 238 . 1000 Schwarz criterion 246.5435 Hannan-Quinn 241 . 4091 rho -0.250338 Durbin's h -3.936468
Step by Step Solution
There are 3 Steps involved in it

Get step-by-step solutions from verified subject matter experts