

Question: After evaluating the regression analysis, answer the following - In general terms, briefly define the term factor as it relates to equity portfolios. - Briefly
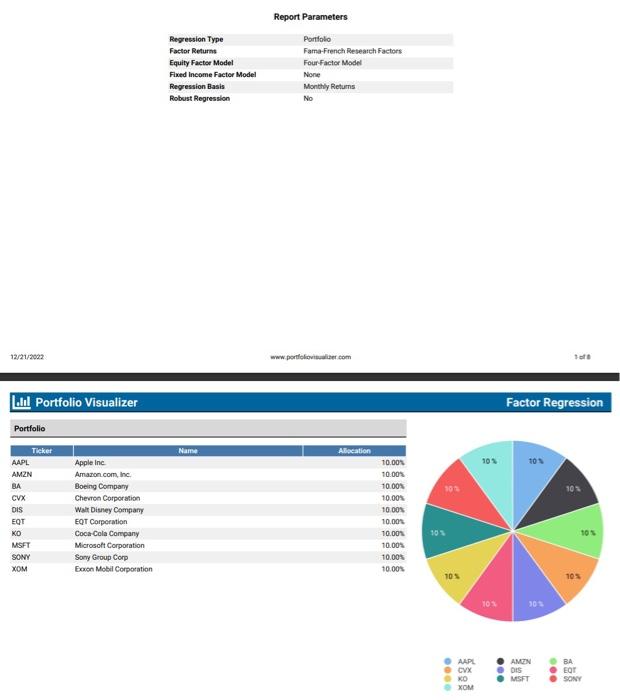
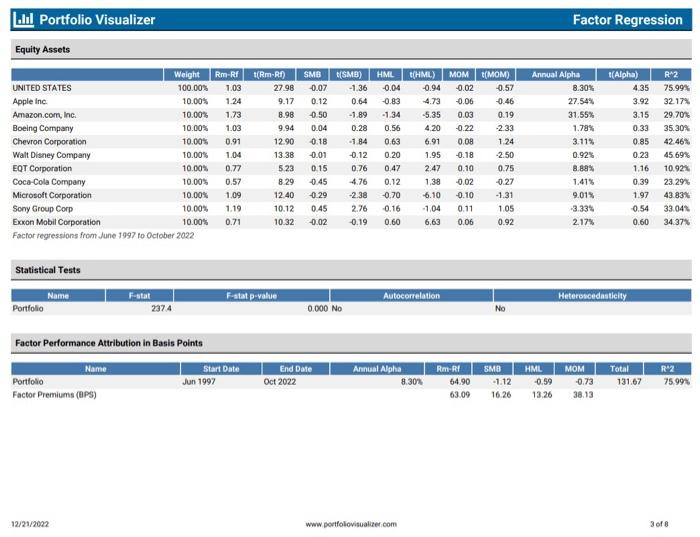
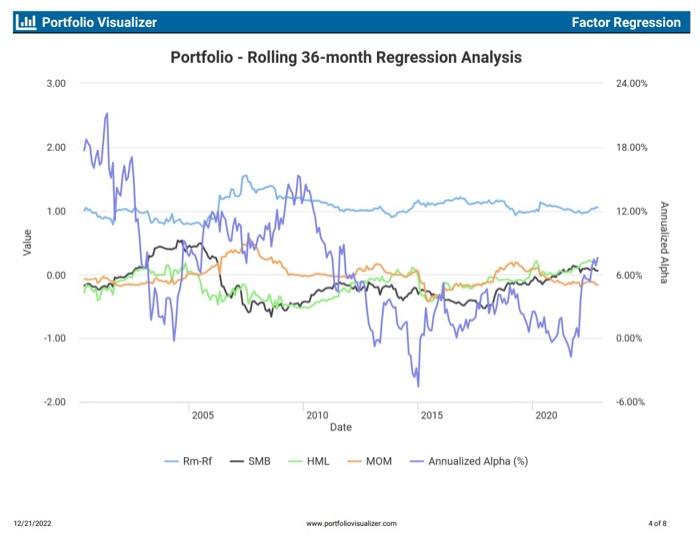
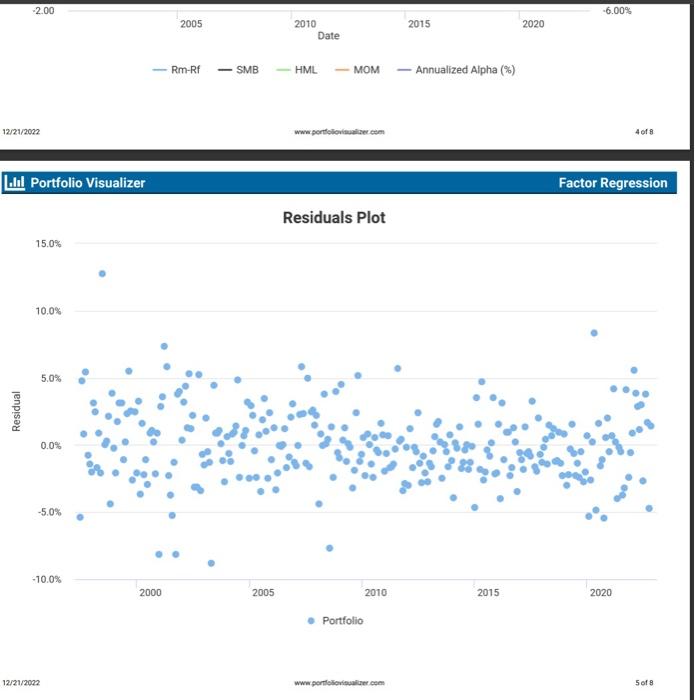
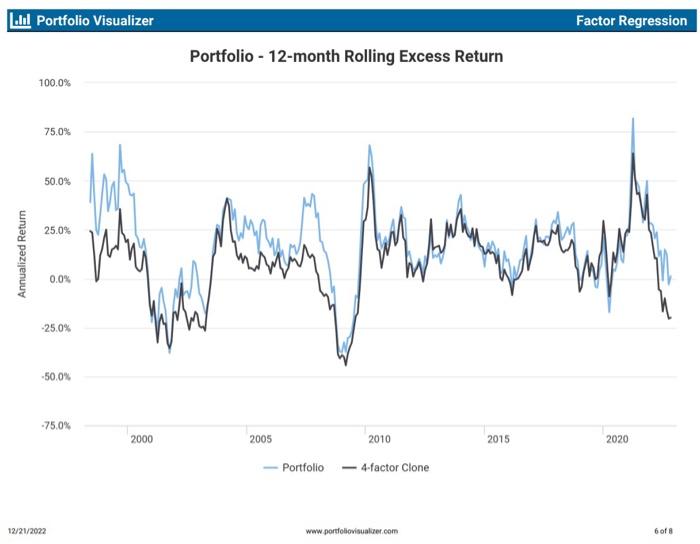
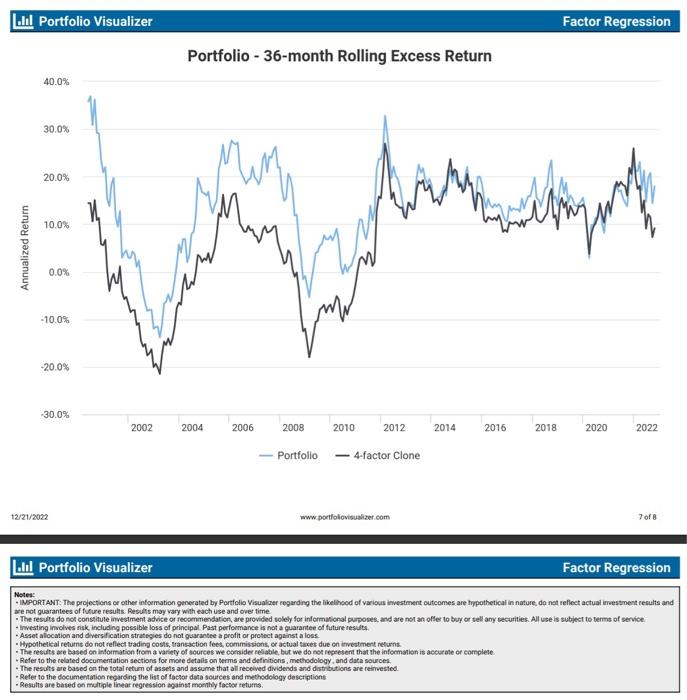
Report Parameters Factor Performance Attribution in Basis Points whl Portfolio Visualizer Factor Regression Portfolio - Rolling 36-month Regression Analysis \begin{tabular}{c|c|c|cc} 2005 & 2010 & 2015 & 6.00% \\ & Date & 2020 & \end{tabular} - Rm-Rf - SMB - HML - MOM - Annualized Alpha (\%) 4 of 8 Residuals Plot 15.0% Factor Regression |al Portfolio Visualizer Factor Regression Portfolio - 12-month Rolling Excess Return 100.0% Notes: - INPORT ANT: The projections or other information generated by Portfolio Visualker regarding the likelihgod of various investment outcomes are hypothetical in nature, do nat refiect actual inrestment results and are not guarantees of fufure resulas Results may vary with each use and over time. - The results do not constitule investment advice or recommendation, are provided tolely for informational purposes, and are not an ofles to buy or sell any securities. All use is subject to terms of service. - Investing involves sisk incluading possible loss of principal. Past perfoemance is not a guarartee of future results. - Asset alocation and diversification strategies do not guarantee a profit or protect against a loss. - Hypothelical retums do not reflect trading costs, Iransaction fees, commissions, or actual taxes due on investmert refurnt. - The results are based on information from a variety of sources we consider relable, but we do not represert that the infocmation is accurate or complete. - Refer to the related documentation sections for more details on berms and definitions, methodology, and data sources. - The results are based on the totai return of assets and assume that all received dividends and distributions are reimested. - Reter to the documenation regarding the list of tochor dina sources and methodology descriptions - Resuits are based on muliple inear regression against monthy tactor tetums. Report Parameters Factor Performance Attribution in Basis Points whl Portfolio Visualizer Factor Regression Portfolio - Rolling 36-month Regression Analysis \begin{tabular}{c|c|c|cc} 2005 & 2010 & 2015 & 6.00% \\ & Date & 2020 & \end{tabular} - Rm-Rf - SMB - HML - MOM - Annualized Alpha (\%) 4 of 8 Residuals Plot 15.0% Factor Regression |al Portfolio Visualizer Factor Regression Portfolio - 12-month Rolling Excess Return 100.0% Notes: - INPORT ANT: The projections or other information generated by Portfolio Visualker regarding the likelihgod of various investment outcomes are hypothetical in nature, do nat refiect actual inrestment results and are not guarantees of fufure resulas Results may vary with each use and over time. - The results do not constitule investment advice or recommendation, are provided tolely for informational purposes, and are not an ofles to buy or sell any securities. All use is subject to terms of service. - Investing involves sisk incluading possible loss of principal. Past perfoemance is not a guarartee of future results. - Asset alocation and diversification strategies do not guarantee a profit or protect against a loss. - Hypothelical retums do not reflect trading costs, Iransaction fees, commissions, or actual taxes due on investmert refurnt. - The results are based on information from a variety of sources we consider relable, but we do not represert that the infocmation is accurate or complete. - Refer to the related documentation sections for more details on berms and definitions, methodology, and data sources. - The results are based on the totai return of assets and assume that all received dividends and distributions are reimested. - Reter to the documenation regarding the list of tochor dina sources and methodology descriptions - Resuits are based on muliple inear regression against monthy tactor tetums
Step by Step Solution
There are 3 Steps involved in it

Get step-by-step solutions from verified subject matter experts