

Question: After evaluating the single regression models, Ning generated three more models, each including two of the three possible cost drivers. Select output for each of
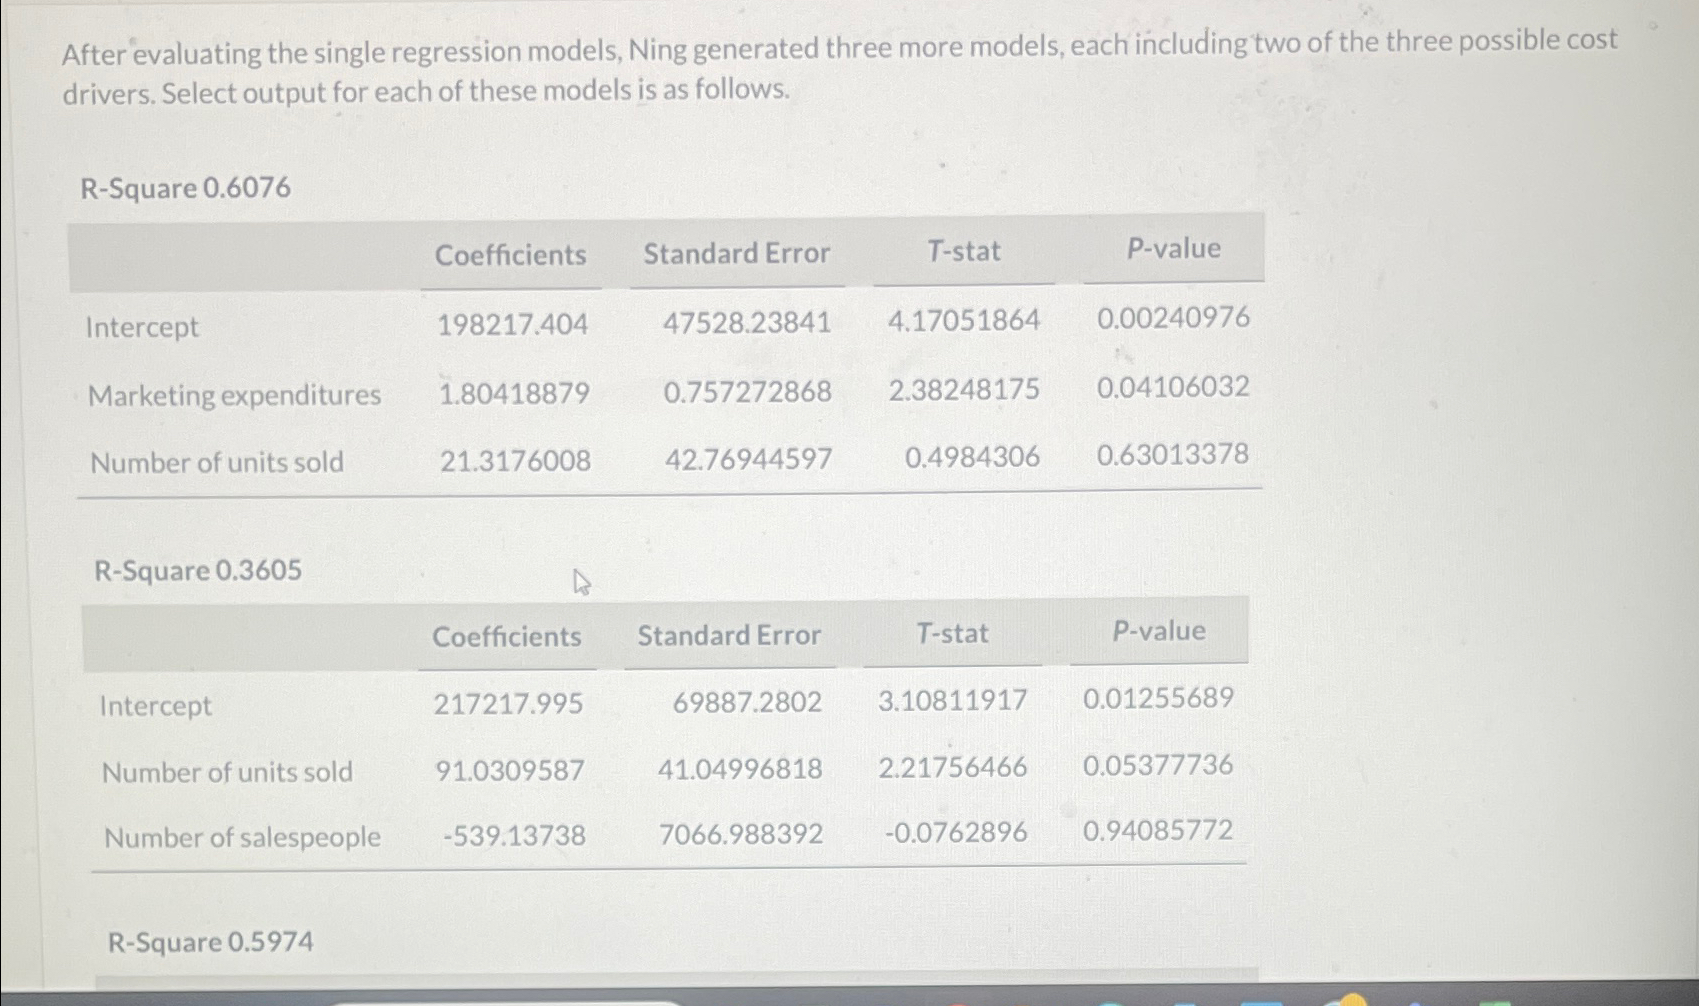
After evaluating the single regression models, Ning generated three more models, each including two of the three possible cost drivers. Select output for each of these models is as follows.\ R-Square 0.6076\ \\\\table[[,Coefficients,Standard Error,,T-stat,P-value],[Intercept,198217.404,,47528.23841,4.17051864,0.00240976],[Marketing expenditures,1.80418879,0.757272868,2.38248175,0.04106032,],[Number of units sold,21.3176008,42.76944597,0.4984306,0.63013378,]]\ R-Square 0.3605\ \\\\table[[,Coefficients,Standard Error,T-stat,P-value],[Intercept,217217.995,69887.2802,3.10811917,0.01255689],[Number of units sold,91.0309587,41.04996818,2.21756466,0.05377736],[Number of salespeople,-539.13738,7066.988392,-0.0762896,0.94085772]]\ R-Square 0.5974
After evaluating the single regression models, Ning generated three more models, each including two of the three possible cost drivers. Select output for each of these models is as follows. R-Square 0.6076 R-Square 0.5974
Step by Step Solution
There are 3 Steps involved in it

Get step-by-step solutions from verified subject matter experts