

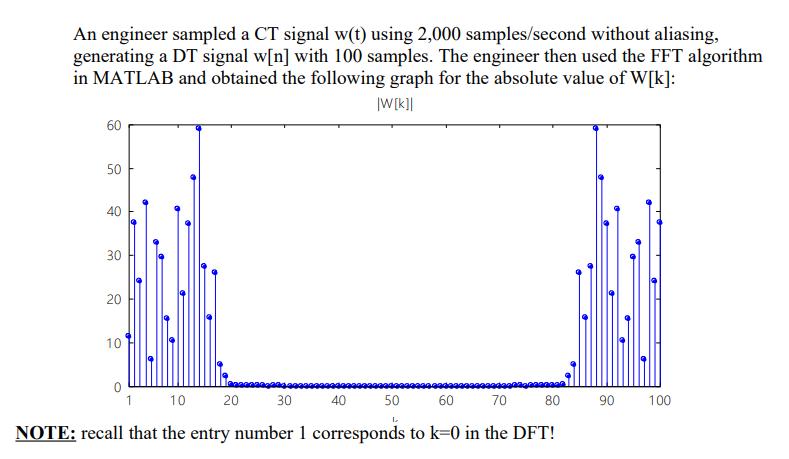
Question: An engineer sampled a CT signal w(t) using 2,000 samples/second without aliasing, generating a DT signal w[n] with 100 samples. The engineer then used
![generating a DT signal w[n] with 100 samples. The engineer then used](https://dsd5zvtm8ll6.cloudfront.net/questions/2024/02/65c31de89ab4c_1707286015938.jpg)
![absolute value of W[k]: |W[k]| 60 50 40 30 20 10 1](https://dsd5zvtm8ll6.cloudfront.net/questions/2024/02/65c31de867146_1707286015793.jpg)
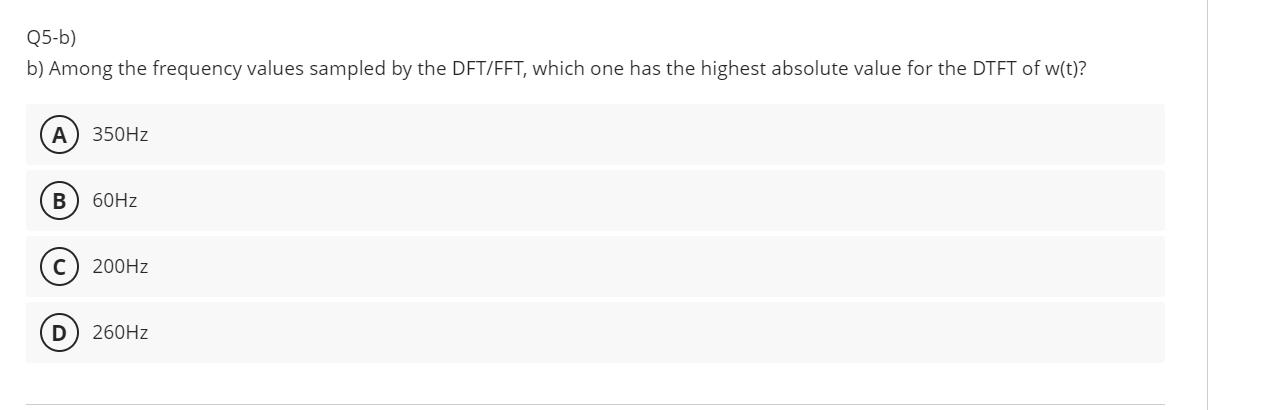
An engineer sampled a CT signal w(t) using 2,000 samples/second without aliasing, generating a DT signal w[n] with 100 samples. The engineer then used the FFT algorithm in MATLAB and obtained the following graph for the absolute value of W[k]: |W[k]| 60 50 40 30 20 10 1 10 60 70 80 NOTE: recall that the entry number 1 corresponds to k=0 in the DFT! 20 30 40 50 L 90 100 5) An engineer sampled a CT signal w(t) using 2,000 samples/second without aliasing, generating a DT signal w[n] with 100 samples a) Based on the above graph, estimate the maximum frequency component of the CT signal w(t) A 750Hz B 500Hz D 200Hz 360Hz Q5-b) b) Among the frequency values sampled by the DFT/FFT, which one has the highest absolute value for the DTFT of w(t)? A 350Hz B 60Hz C 200Hz D 260Hz Q5) c) Estimate the value of the DTFT |W(exp(jw)| for w=0.12. A 42 B 30 C 40 D 10
Step by Step Solution
3.25 Rating (143 Votes )
There are 3 Steps involved in it
The detailed answer for the above question is provided below A In the given graph we know that N2 sa... View full answer

Get step-by-step solutions from verified subject matter experts