

Question: AGB 2 1 2 Sp 2 4 / Unit 1 Quant Assessment Retake Problem Q 9 The graph below includes indifference curves and budget lines
AGB Sp Unit Quant Assessment Retake
Problem Q
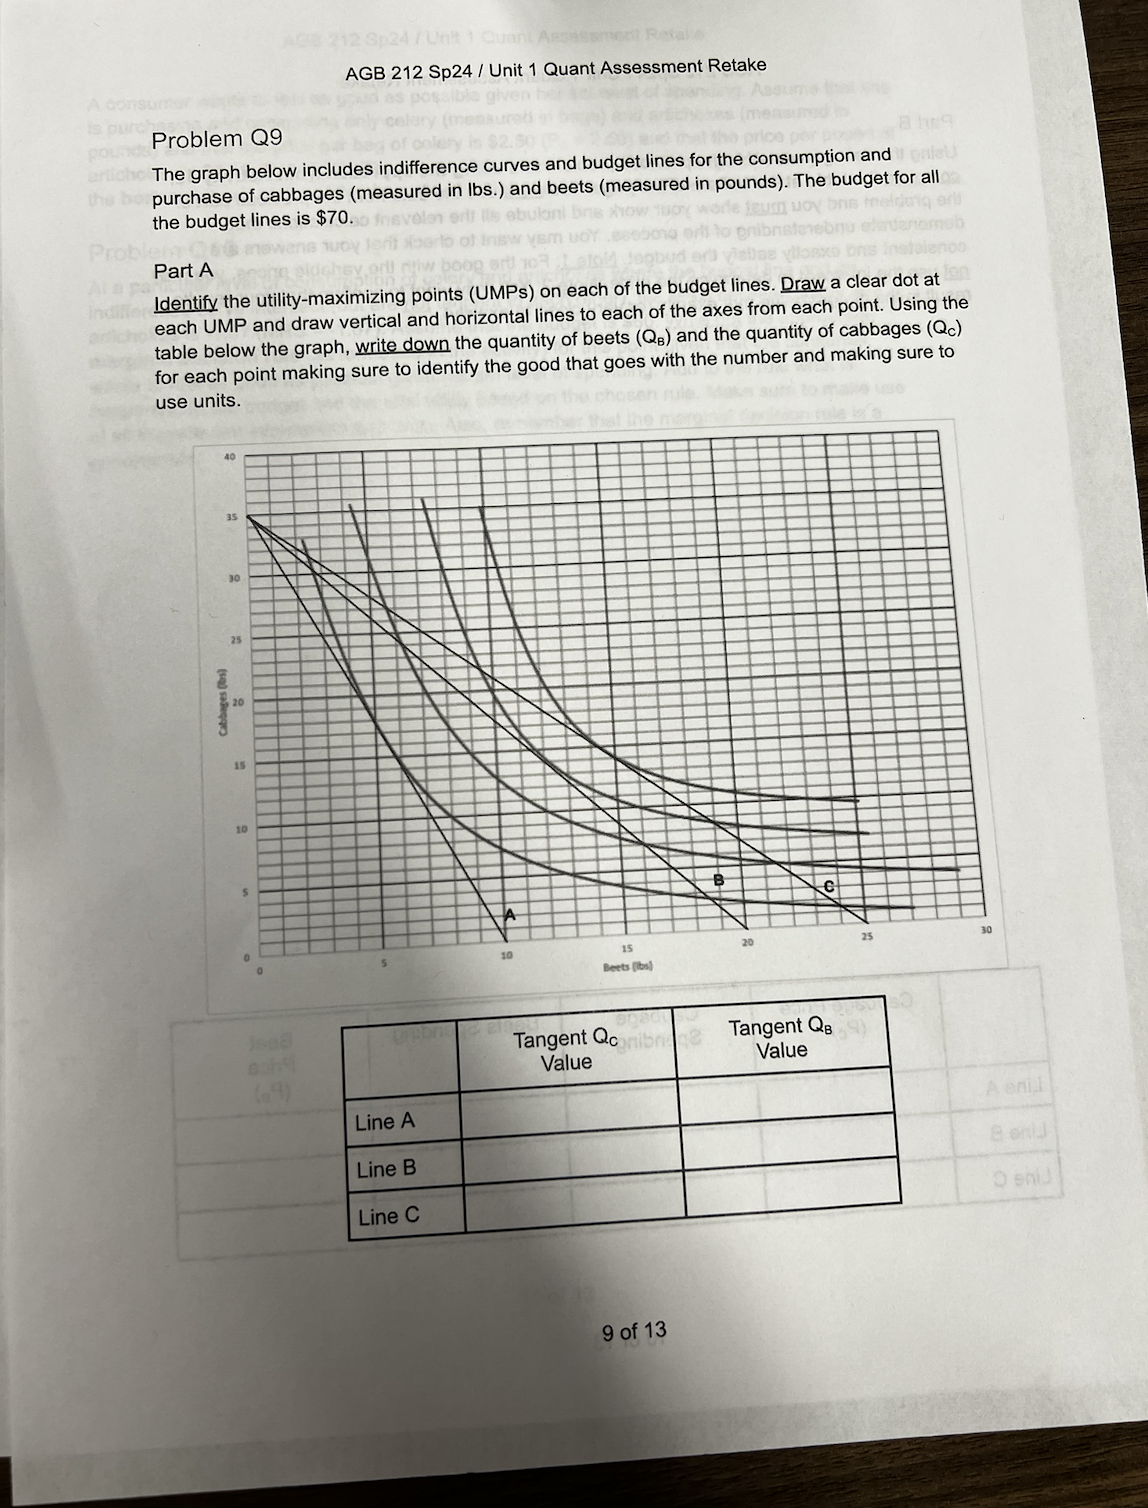
The graph below includes indifference curves and budget lines for the consumption and purchase of cabbages measured in lbs and beets measured in pounds The budget for all the budget lines is $
Part
Identify the utilitymaximizing points UMPs on each of the budget lines. Draw a clear dot at each UMP and draw vertical and horizontal lines to each of the axes from each point. Using the table below the graph, write down the quantity of beets and the quantity of cabbages for each point making sure to identify the good that goes with the number and making sure to use units.
tabletableTangent QCValuetableTangent QBValueLine ALine BLine C
of
Step by Step Solution
There are 3 Steps involved in it
1 Expert Approved Answer
Step: 1 Unlock

Question Has Been Solved by an Expert!
Get step-by-step solutions from verified subject matter experts
Step: 2 Unlock
Step: 3 Unlock