

Question: Age group/Class Limit Frequency Summary Statistics Frequency 25 Histogram 20 15 10 LO 5 0 21 30 50 60 70 80 More Age Race
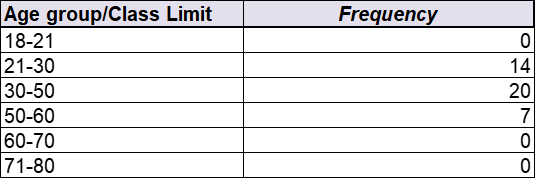
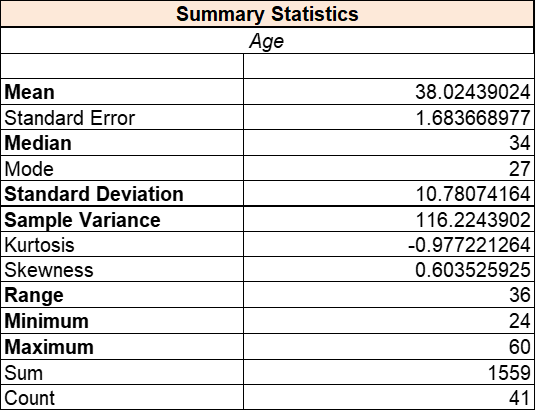
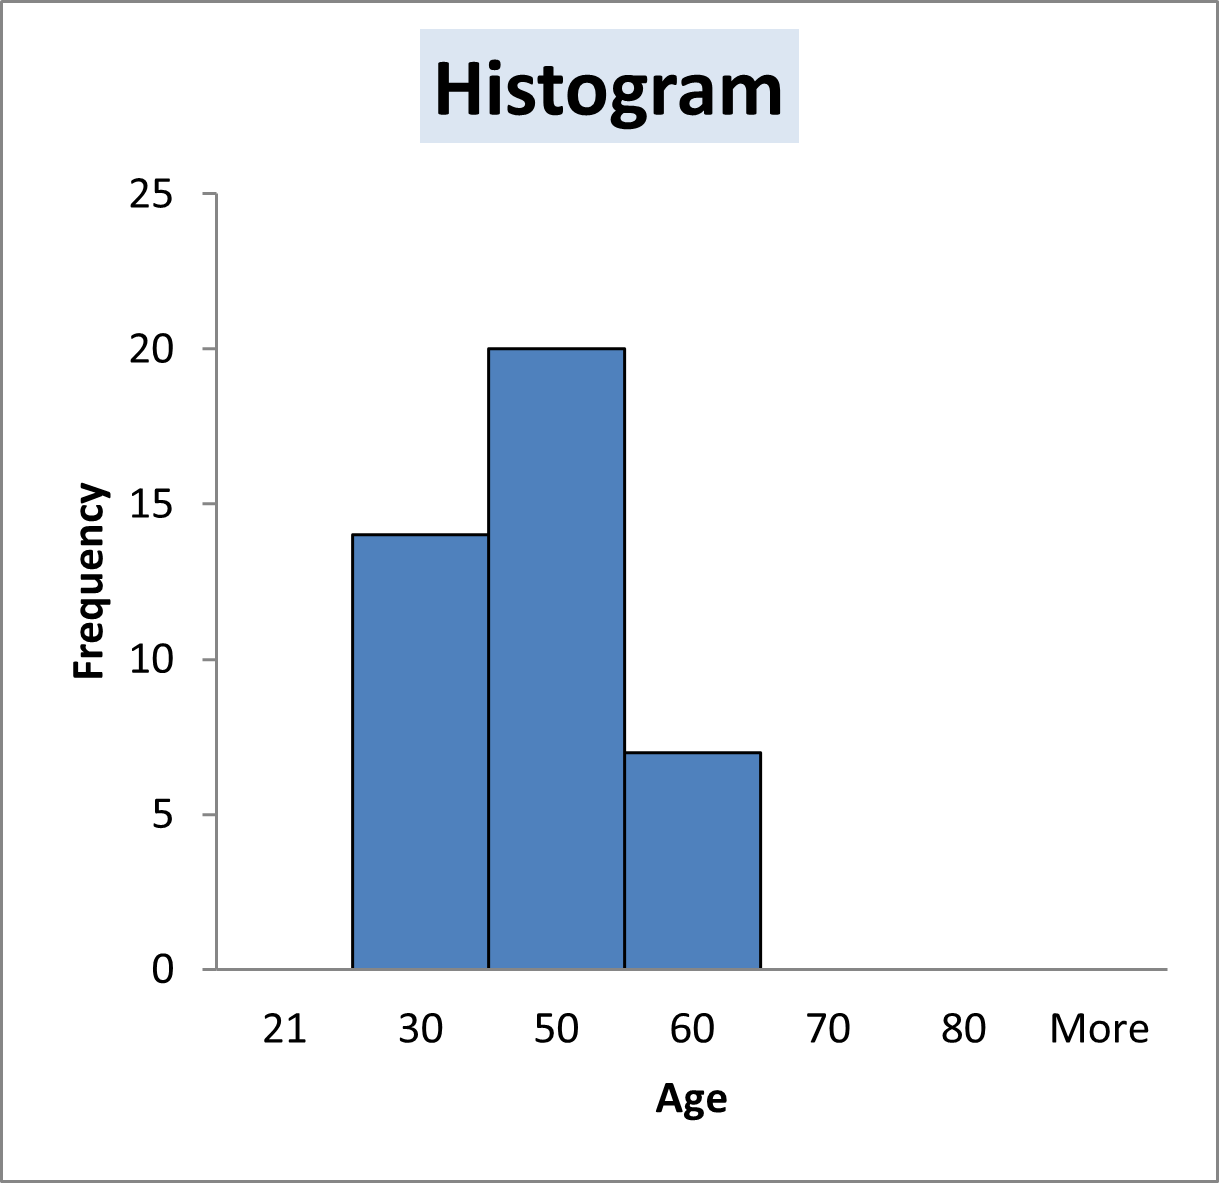
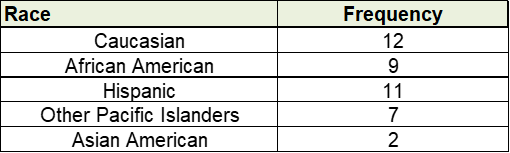
Age group/Class Limit Frequency Summary Statistics Frequency 25 Histogram 20 15 10 LO 5 0 21 30 50 60 70 80 More Age Race Frequency
Step by Step Solution
There are 3 Steps involved in it
1 Expert Approved Answer
Step: 1 Unlock

Question Has Been Solved by an Expert!
Get step-by-step solutions from verified subject matter experts
Step: 2 Unlock
Step: 3 Unlock