

Question: a)Generate a scatter plot for the data with the independent variable on the x-axis.(2 marks)b) Given that the equation of the regression line is y
a)Generate a scatter plot for the data with the independent variable on the x-axis.(2 marks)b) Given that the equation of the regression line is y = 0.58x - 3.10, how manywolves would the regression equation predict when the number of rabbits iszero? (1 mark)C)Given that R? = 0.7486, calculate the correlation coefficient. Does it indicate aweak or a strong relationship? (2 marks)d) Calculate the residual values of all data points. (2 marks)
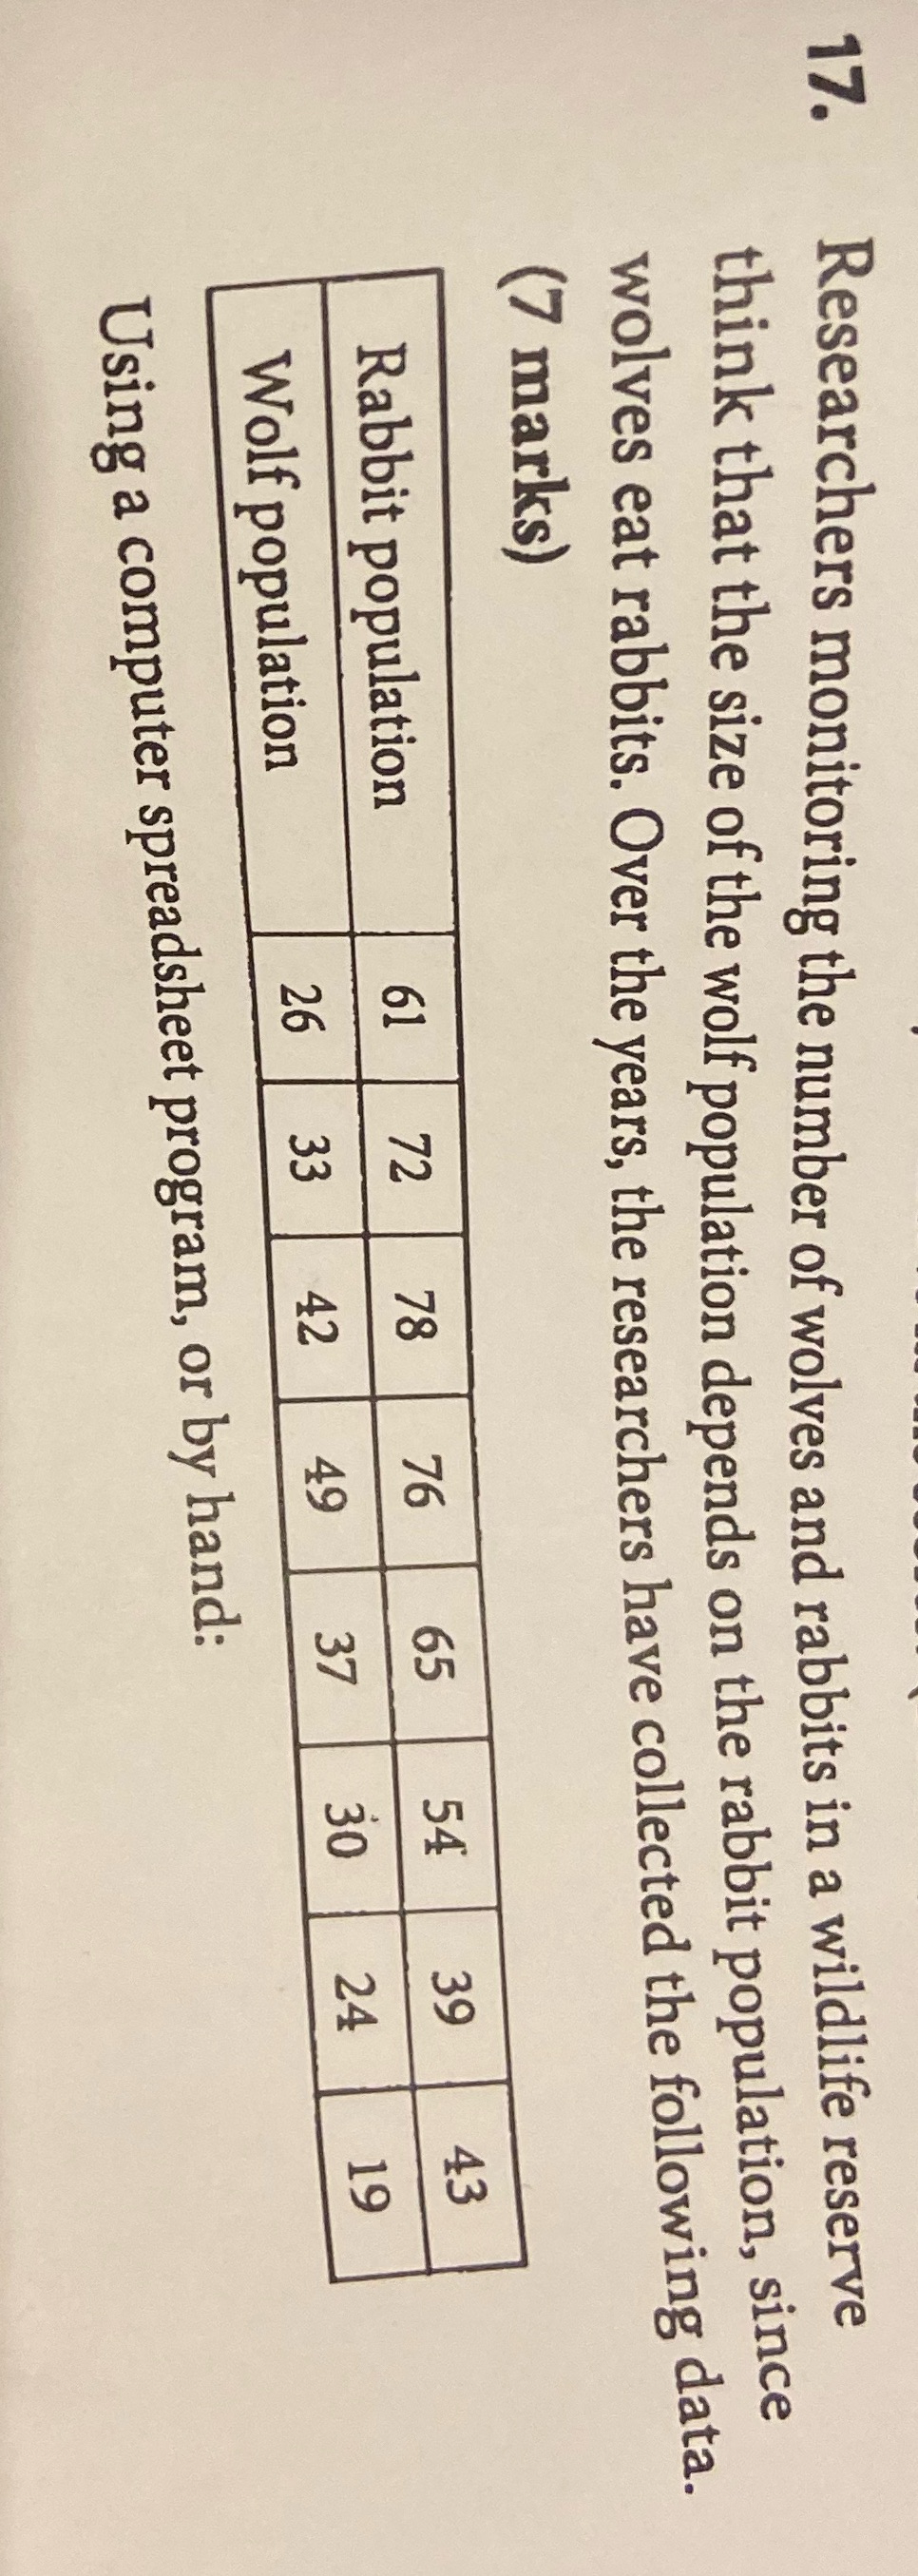
Researchers monitoring the number of wolves and rabbits in a wildlife reserve think that the size of the wolf population depends on the rabbit population, since wolves eat rabbits. Over the years, the researchers have collected the following data. (7 marks) Rabbit population Wolf population Using a computer spreadsheet program, or by hand
Step by Step Solution
There are 3 Steps involved in it

Get step-by-step solutions from verified subject matter experts