

Question: Aggregrate Planning Problem begin{tabular}{|c|c|c|} hline Month & Working Days & Forcast hline Jan & 22 & 700 hline Feb & 20 & 850
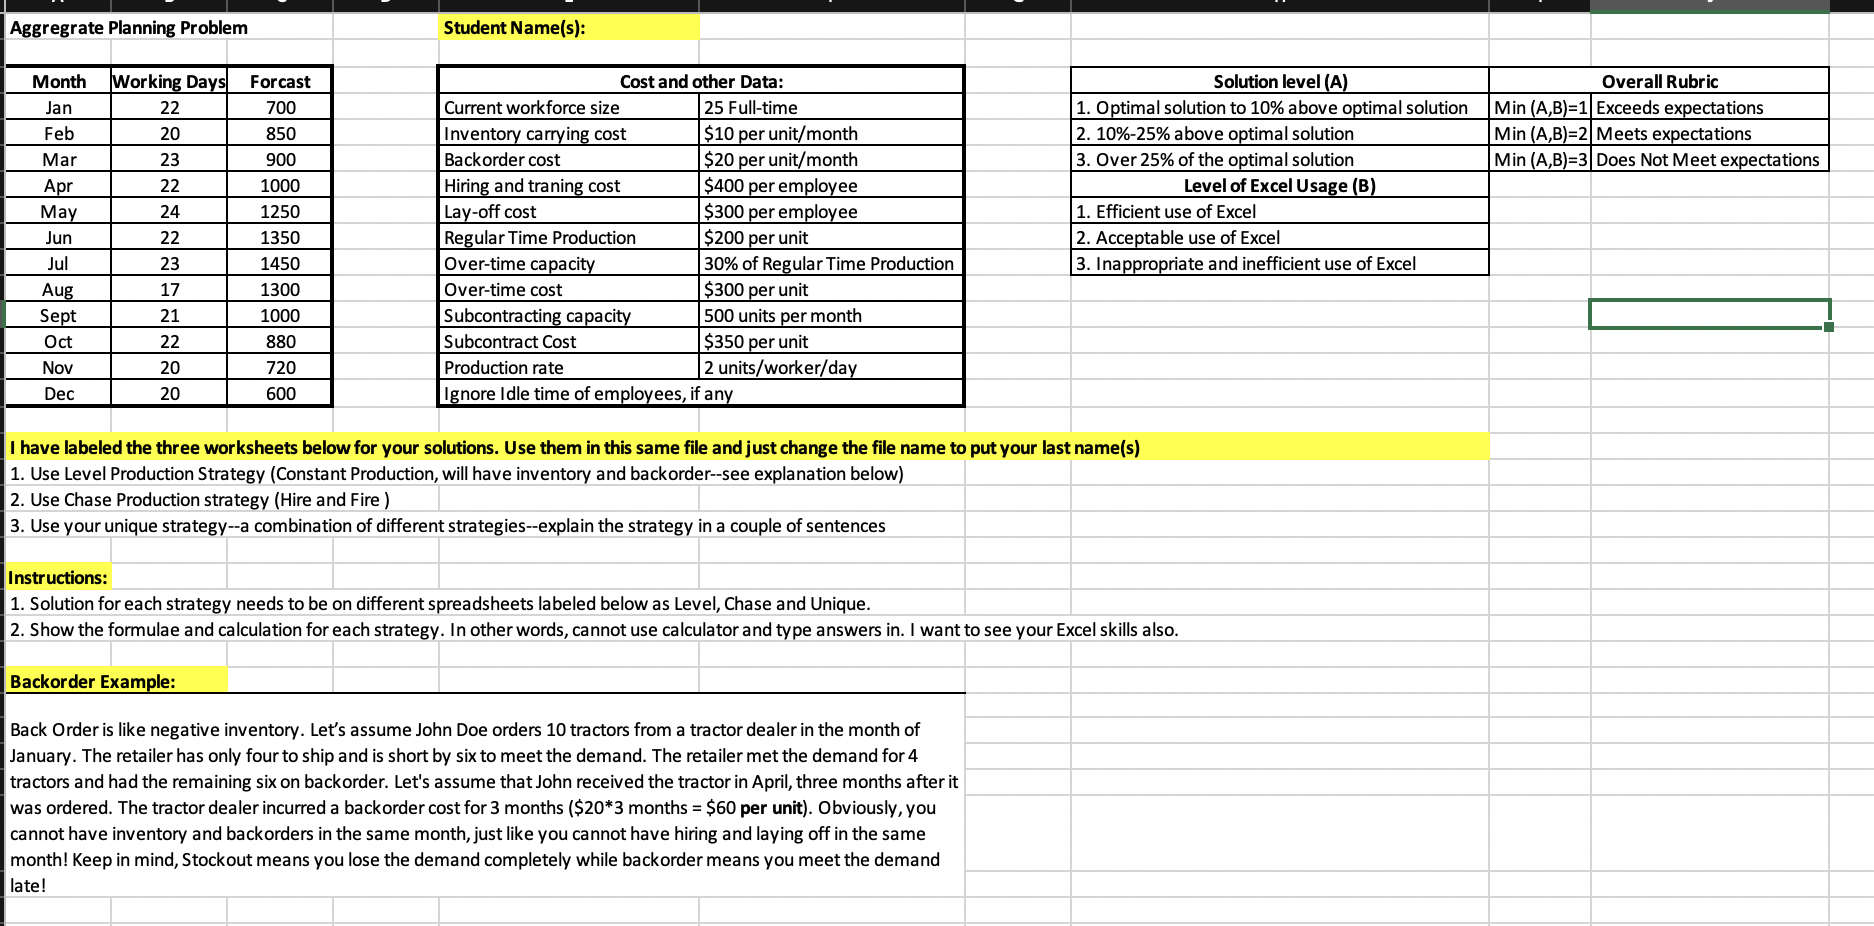
Aggregrate Planning Problem \begin{tabular}{|c|c|c|} \hline Month & Working Days & Forcast \\ \hline Jan & 22 & 700 \\ \hline Feb & 20 & 850 \\ \hline Mar & 23 & 900 \\ \hline Apr & 22 & 1000 \\ \hline May & 24 & 1250 \\ \hline Jun & 22 & 1350 \\ \hline Jul & 23 & 1450 \\ \hline Aug & 17 & 1300 \\ \hline Sept & 21 & 1000 \\ \hline Oct & 22 & 880 \\ \hline Nov & 20 & 720 \\ \hline Dec & 20 & 600 \\ \hline \end{tabular} Student Name(s): \begin{tabular}{|l|l|} \hline \multicolumn{2}{|c|}{ Cost and other Data: } \\ \hline Current workforce size & 25 Full-time \\ \hline Inventory carrying cost & $10 per unit/month \\ \hline Backorder cost & $20 per unit/month \\ \hline Hiring and traning cost & $400 per employee \\ \hline Lay-off cost & $300 per employee \\ \hline Regular Time Production & $200 per unit \\ \hline Over-time capacity & 30% of Regular Time Production \\ \hline Over-time cost & $300 per unit \\ \hline Subcontracting capacity & 500 units per month \\ \hline Subcontract Cost & $350 per unit \\ \hline Production rate & 2 units/worker/day \\ \hline Ignore Idle time of employees, if any \\ \hline \end{tabular} \begin{tabular}{|c|c|c|} \hline Solution level (A) & & Overall Rubric \\ \hline 1. Optimal solution to 10% above optimal solution & Min(A,B)=1 & Exceeds expectations \\ \hline 2. 10%25% above optimal solution & Min(A,B)=2 & Meets expectations \\ \hline 3. Over 25% of the optimal solution & Min(A,B)=3 & Does Not Meet expectations \\ \hline \multicolumn{3}{|l|}{ Level of Excel Usage (B) } \\ \hline \multicolumn{3}{|l|}{ 1. Efficient use of Excel } \\ \hline \multicolumn{3}{|l|}{ 2. Acceptable use of Excel } \\ \hline 3. Inappropriate and inefficient use of Excel & & \\ \hline & & \\ \hline \end{tabular} I have labeled the three worksheets below for your solutions. Use them in this same file and just change the file name to put your last name(s) 1. Use Level Production Strategy (Constant Production, will have inventory and backorder--see explanation below) 2. Use Chase Production strategy (Hire and Fire) 3. Use your unique strategy--a combination of different strategies--explain the strategy in a couple of sentences Instructions: 1. Solution for each strategy needs to be on different spreadsheets labeled below as Level, Chase and Unique. 2. Show the formulae and calculation for each strategy. In other words, cannot use calculator and type answers in. I want to see your Excel skills also. Backorder Example: Back Order is like negative inventory. Let's assume John Doe orders 10 tractors from a tractor dealer in the month of January. The retailer has only four to ship and is short by six to meet the demand. The retailer met the demand for 4 tractors and had the remaining six on backorder. Let's assume that John received the tractor in April, three months after it was ordered. The tractor dealer incurred a backorder cost for 3 months ($203 months =$60 per unit). Obviously, you cannot have inventory and backorders in the same month, just like you cannot have hiring and laying off in the same month! Keep in mind, Stockout means you lose the demand completely while backorder means you meet the demand late
Step by Step Solution
There are 3 Steps involved in it

Get step-by-step solutions from verified subject matter experts